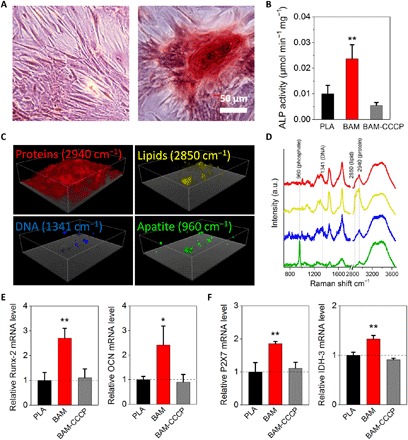
Fig. 4. Degradation fragments of BAM enhance in vitro osteogenesis.

(A) ARS staining of rMSCs undergoing osteogenic differentiation for 3 weeks in vitro. Scale bar, 50 μm. (B) ALP activity of rMSCs undergoing osteogenic differentiation. Cells were incubated with osteogenic induction medium supplemented with PLA and BAM degradation fragments with or without uncoupler CCCP (10 μM) for 7 days. Data are determined using ALP kit and normalized by the total protein. (C) 3D reconstructed confocal Raman spectroscopy images of distinct peaks associated with proteins (CH3 stretching vibrations at 2940 cm−1), lipids (CH2 stretching vibrations at 2850 cm−1), DNA (1341 cm−1), and apatite [ν1(PO4) at 960 cm−1] in the BAM group. (D) Representative Raman spectra of cellular regions containing proteins, lipids, DNA, and apatite, respectively. All Raman spectra have been baseline-corrected, normalized, and offset for clarity. (E and F) Expression for runt-related transcription factor 2 (Runx-2), osteocalcin (OCN), purinoceptors (P2X7), and isocitrate dehydrogenase (IDH-3) genes as relative to PLA control. Results in (B), (E), and (F) represent the means ± SD (n = 3 biological repeats). Statistical analysis: One-way ANOVA with Tukey’s post hoc test. *P < 0.05, significant differences between BAM and PLA groups. **P < 0.01, highly significant differences between BAM and PLA groups.
