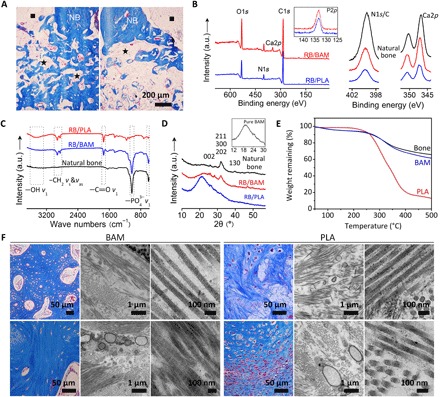
Fig. 6. Morphological and spectral assessment of repair tissue in femoral bone defects.

(A) Masson trichrome staining for the regenerated bone, comparing BAM (left) and PLA (right) scaffold-induced repair after 12 weeks. NB, native bone; black squares, marrow cavity; black stars, residual implants; red arrows, new bone. Scale bar, 200 μm. (B) XPS, (C) FTIR, and (D) WAXD analysis on repair tissues in BAM, PLA scaffolds, and natural bone. (E) TG analysis of the repair tissue in BAM and PLA groups; natural bone (rabbit femur) was used as control. (F) Masson trichrome staining and transmission electron microscopy (TEM) micrographs for visualizing collagen at the defect region after 4 weeks (top) and 12 weeks (bottom) regeneration. TEM images at low magnification illustrate the pattern of collagen bundles, and higher-magnification images to the right depict fibrils in detail.
