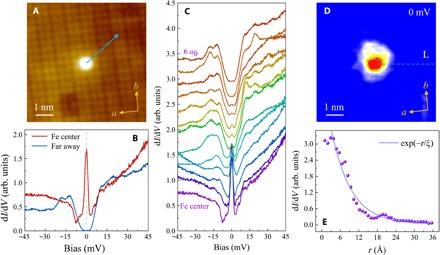
Fig. 4. Spatial evolution of the ZEBS in high-quality 1-UC FeTe0.5Se0.5/SrTiO3(001).

(A) Topographic image of an isolated Fe adatom (6.75 nm × 6.75 nm; set point: V = 0.1 V, I = 500 pA). (B) Tunneling spectra taken upon the Fe-adatom center and far away. (C) Spatially resolved tunneling spectra (vertically offset for clarity) along the arrow in (A). (D) dI/dV mapping at 0 mV for the Fe adatom in (A). (E) Linecut (solid symbols) along the dashed line, L, in (D) and corresponding exponential fitting (solid curve) by dI/dV(r,0 mV) ∝ exp(− r/ξ), showing ZBC as a function of the distance, r, relative to the Fe-adatom center.
