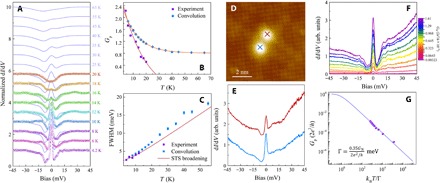
Fig. 5. Perturbation of the ZEBS in 1-UC FeTe0.5Se0.5 by temperature, a neighboring Fe adatom, and different tunneling barriers.

(A) Temperature dependence of the experimental tunneling spectra (open symbols) measured upon the Fe-adatom center in Fig. 4A and the convoluted 4.2-K spectra (solid curves) by Fermi-Dirac distribution function at higher temperatures (both vertically offset for clarity). The experimental spectra have been normalized by their respective cubic-polynomial backgrounds for clarity, which are obtained from fitting to the spectra for bias |V| ≥ 30 mV. (B) Gp plotted as a function of temperature (solid symbols) extracted from (A). (C) FWHM of the ZBCP (solid symbols) in the experimental and convoluted spectra of (A). The solid curve is the spectral energy resolution combining both instrumental and thermal broadening ΔE plotted versus temperature. (D) Topographic image of an Fe-adatom dimer (8 nm × 8 nm; set point: V = 0.1 V, I = 500 pA). (E) Tunneling spectra (vertically offset for clarity) taken upon the Fe adatoms in (D). (F) GN dependence of the ZEBS spectra (4.2 K). (G) Scaling analysis of Gp of the tunneling spectra of (F). Solid curve, calculated Gp for the MZM at different kBT/Γ according to Eq. 1; solid symbols, experimental Gp plotted as a function of GN rescaled as kBT/Γ to match the calculated curve, yielding .
