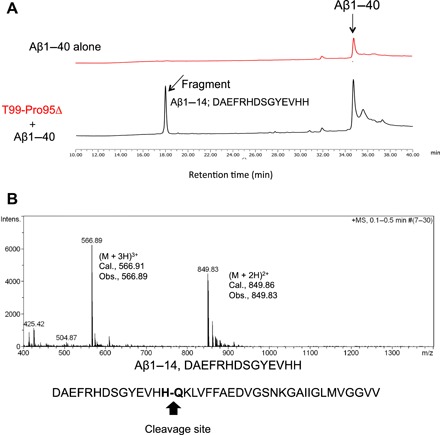
Fig. 3. Cleavage of Aβ1–40 molecule by T99-Pro95(−).

(A) HPLC analysis results for the Aβ1–40 molecule. In the case of the Aβ1–40 peptide (100 μM), a peak at the retention time of around 34.8 min was detected. When the Aβ1–40 peptide was mixed with the T99-Pro95(−) catalytic light chain (10 μM), a new peak was observed at the retention time of 17.7 min. (B) Mass spectroscopy analysis. The peak appearing at the retention time of 18 min was analyzed by mass spectroscopy. The divalent mass was detected at 849.96 m/2z and the trivalent mass at 566.91 m/3z. This was identified as a fragment, DAEFRHDSGYEVHH, from the Aβ1–40 peptide, indicating that the H13-Q14 peptide bond was cleaved.
