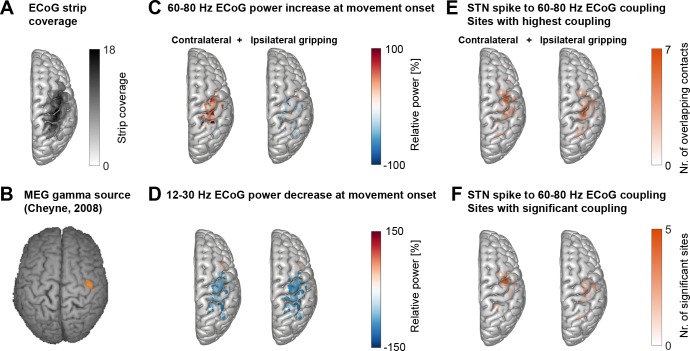
Figure 2. Cortical topography of STN spike-to-cortical gamma coupling and power changes.
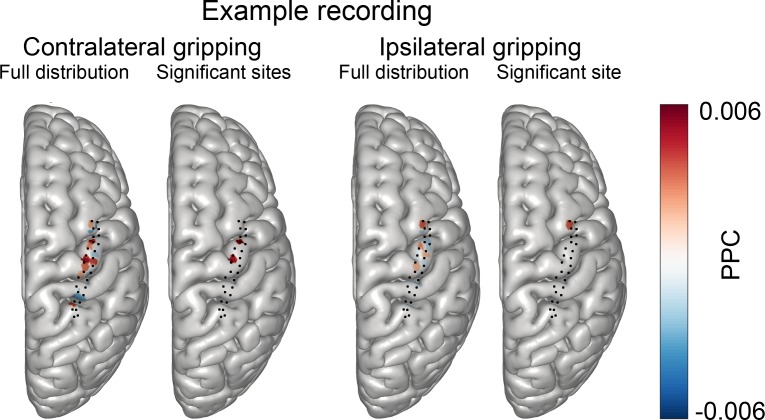
(A) ECoG strips were distributed mainly over precentral and parietal areas. ECoG coordinates from recordings performed in the left hemisphere were flipped in the x-axis to allow averaging across recordings performed in the left and right hemisphere. The maximum number of overlapping recordings was 18 (dark areas). (B) A magnetoencephalography study in healthy participants showed independently from our study that gamma oscillations at the onset of finger movements are focal to lateral motor cortex (Cheyne et al., 2008). (C) Gamma power increased most strongly over motor and somatosensory cortical areas during contralateral gripping. (D) Beta power decreased in spatially more widespread areas. (E) The left and right plots show the two sets of sites that showed the highest 60–80 Hz STN spike-to-cortical gamma coupling during contralateral and ipsilateral gripping, respectively. Each set includes one single site per recorded hemisphere (n = 28). These sites were chosen for further analyses. (F) As (E) but reduced to the sites showing significant gamma coupling −0.1–0.4 s around movement onset (α = 0.1 to show the location of a larger number of contacts). If several channels of one recording were significant, only the channel with the highest PLV was included. The contacts that showed significant gamma PLV during contralateral gripping were concentrated over precentral cortex. This hotspot corresponds well with the 60–90 Hz gamma source localized in MEG studies (Cheyne et al., 2008) shown in B). The significant contacts for ipsilateral gripping were scattered over a wider area. See also Figure 2—figure supplement 1.
© 2008 Elsevier
Figure 2B is reprinted with permission from Cheyne et al. (2008) . It is not covered by the CC-BY 4.0 licence and further reproduction of this panel would need permission from the copyright holder.


