. 2020 Mar 11;9:e51956. doi: 10.7554/eLife.51956

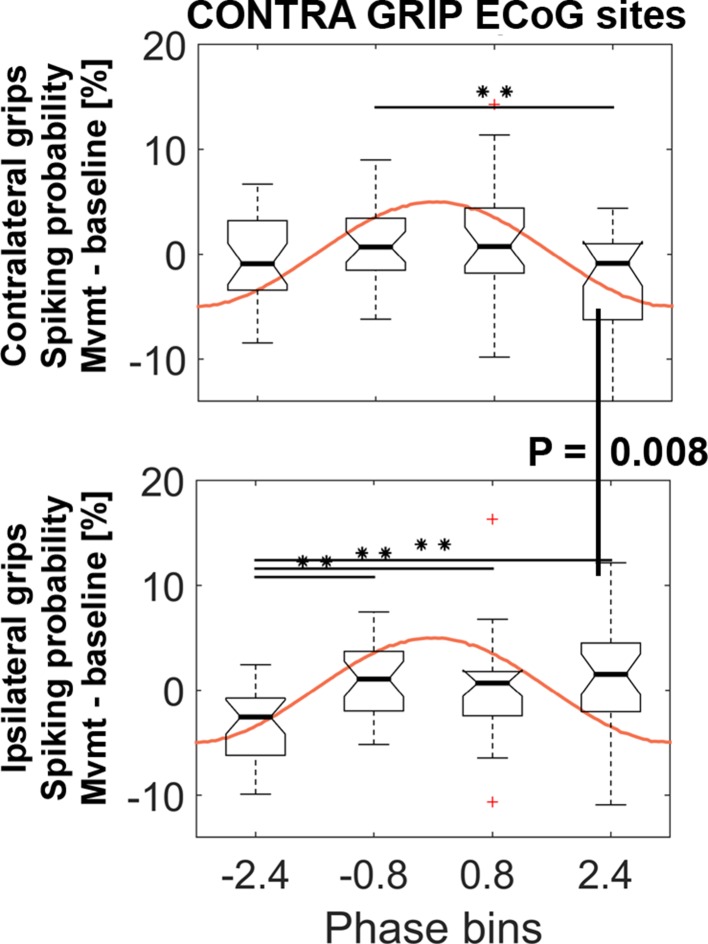
Figure 5. STN spiking probability is modulated relative to the phase of cortical gamma.

The top plot shows how spiking probabilities during contralateral grip onset co-modulate with the gamma phase. * show FDR-corrected significant differences between phase bins. Spiking was relatively reduced in BIN4 during contralateral gripping. It was significantly lower than during ipsilateral gripping (bottom plot, Wilcoxon signed-rank test, p=0.008). The central mark of the box plots displays the median and edges show the 25th and 75th percentile. Whiskers show the 1.5*interquartile range and outliers (red crosses) are data points beyond this range. See also Figure 5—figure supplements 14.

Figure 5.

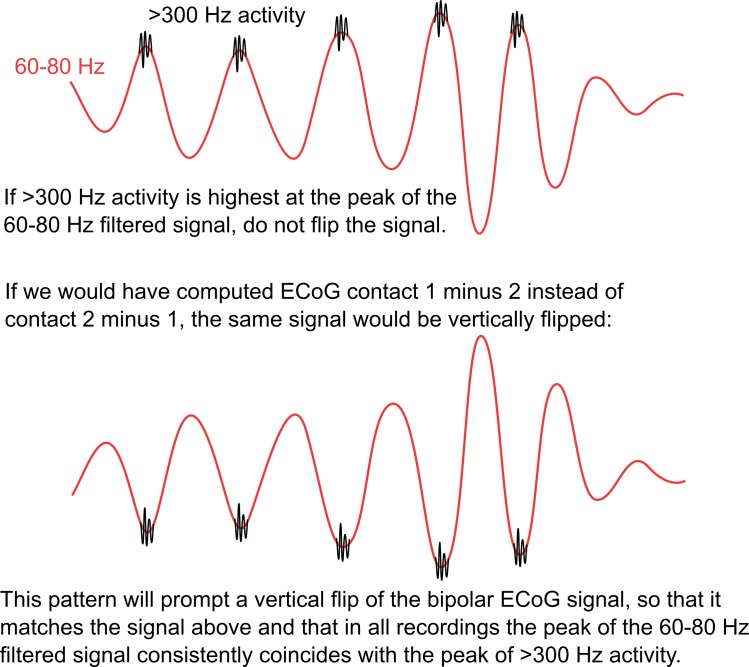
Figure 5—figure supplement 1. Description of the rationale behind the polarity flipping procedure.

Figure 5—figure supplement 1.

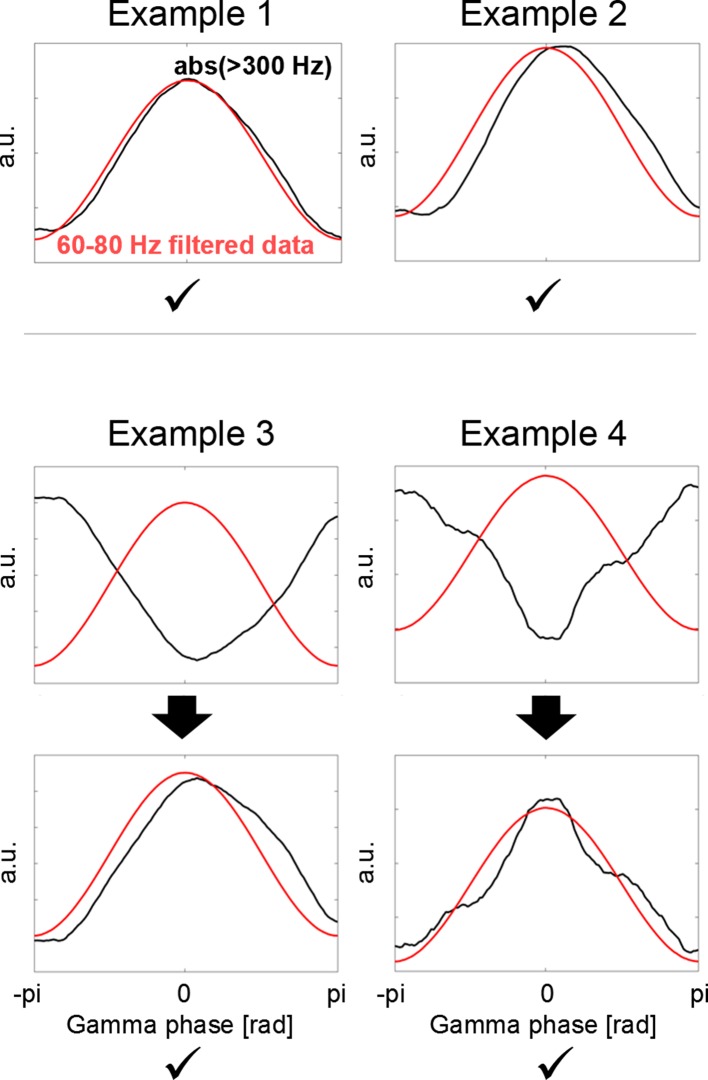
Figure 5—figure supplement 2. Polarity standardization procedure.

Figure 5—figure supplement 2.

Whether we see a trough or instead a peak in the gamma signal depends on the order of subtraction of two neighbouring contacts when calculating the bipolar configuration. To ensure that the polarity is consistent across all recordings, cortical high-frequency activity (HFA = rectified > 300 Hz, black line) was used as flipping criterion, as this signal is independent of the order of subtraction and relative location of the source. If the HFA close to the borders of the plot (close to –pi and pi) was higher than in the HFA in the centre (Example 3 + 4), the phase was flipped.
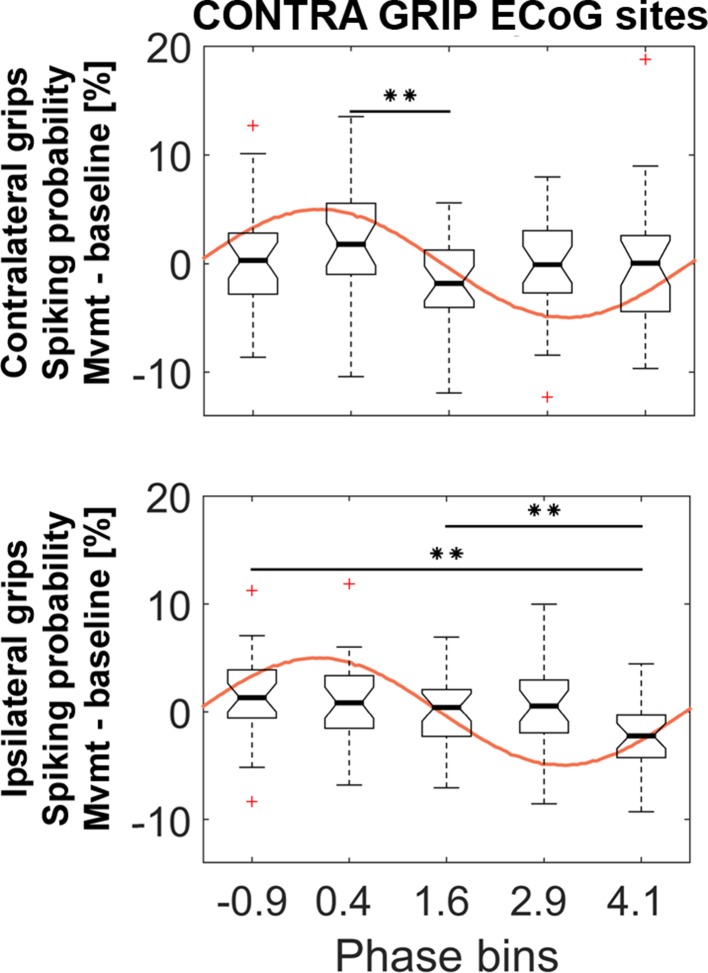
Figure 5—figure supplement 3. Similar analyses as in Figure 5 based on the same ECoG sites but with five instead of four phase bins.

Figure 5—figure supplement 3.

The 5 (bins) x 2 (contra- and ipsilateral gripping) ANOVA showed a significant main effect of bin (F3.8, 102 = 3.5, p=0.012). * show FDR-corrected significant differences between phase bins within contralateral (top) and ipsilateral (bottom) grip trials. The ANOVA showed no significant main effect of effector side (F1, 27 = 12.6, p=0.374) or interaction (F3.5, 95.6 = 1.7, p=0.162). The central mark of the box plots displays the median and edges show the 25th and 75th percentile. Whiskers show the 1.5*interquartile range and outliers (red crosses) are data points beyond this range.
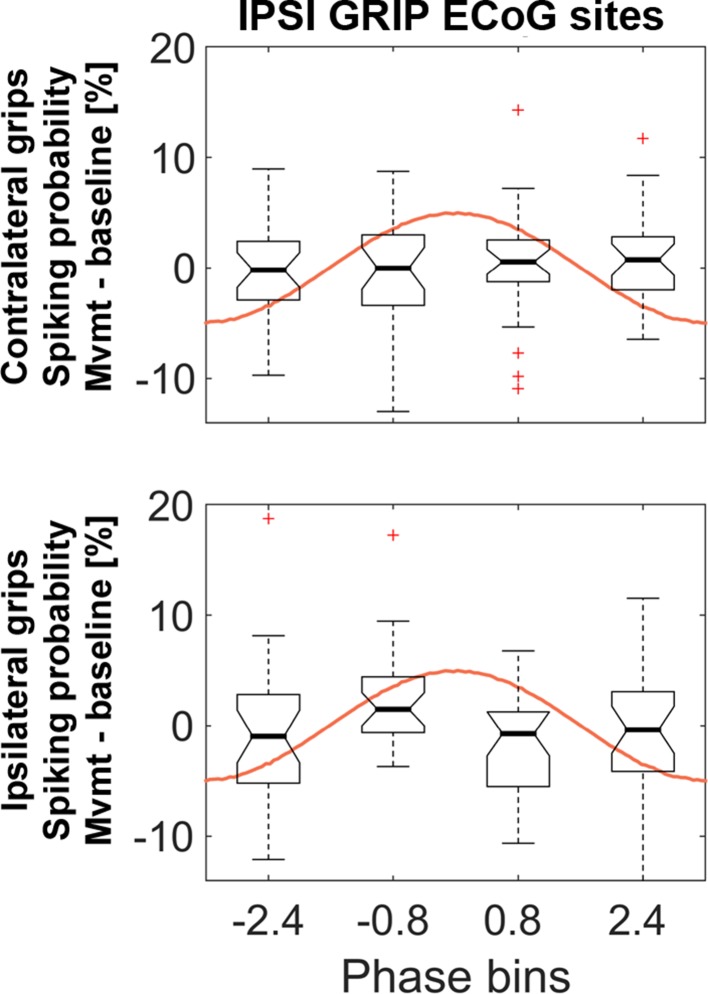
Figure 5—figure supplement 4. Similar analyses as in Figure 5 but based on gamma obtained from the set of ECoG sites that showed the strongest coupling during ipsilateral gripping.

Figure 5—figure supplement 4.

The 4 (bins) x 2 (contra- and ipsilateral gripping) ANOVA was not significant (main effect bins: F3, 81 = 0.6, p=0.586; main effect effector side: F1, 27 = 0.1, p=0.787, interaction: F3, 81 = 1.2, p=0.330). The central mark of the box plots displays the median and edges show the 25th and 75th percentile. Whiskers show the 1.5*interquartile range and outliers (red crosses) are data points beyond this range.