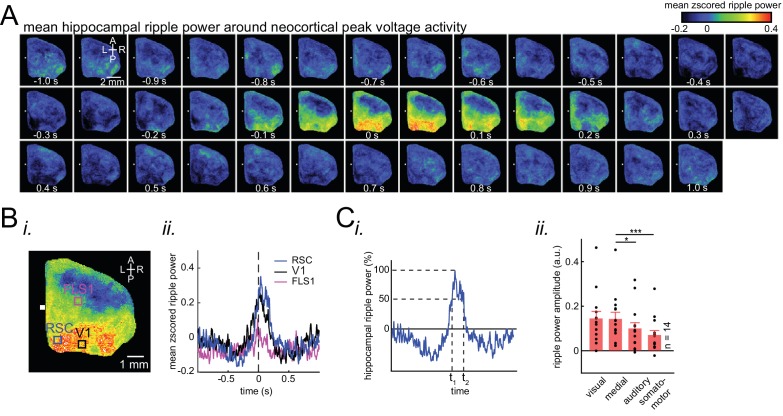
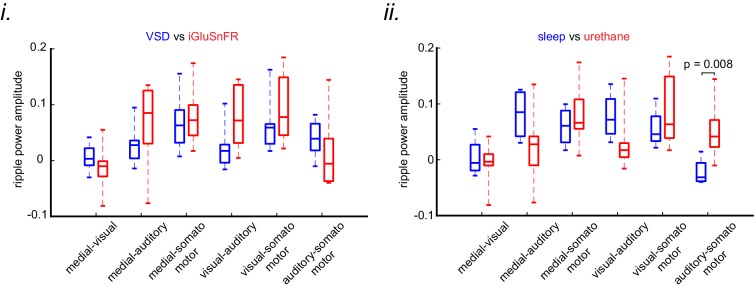
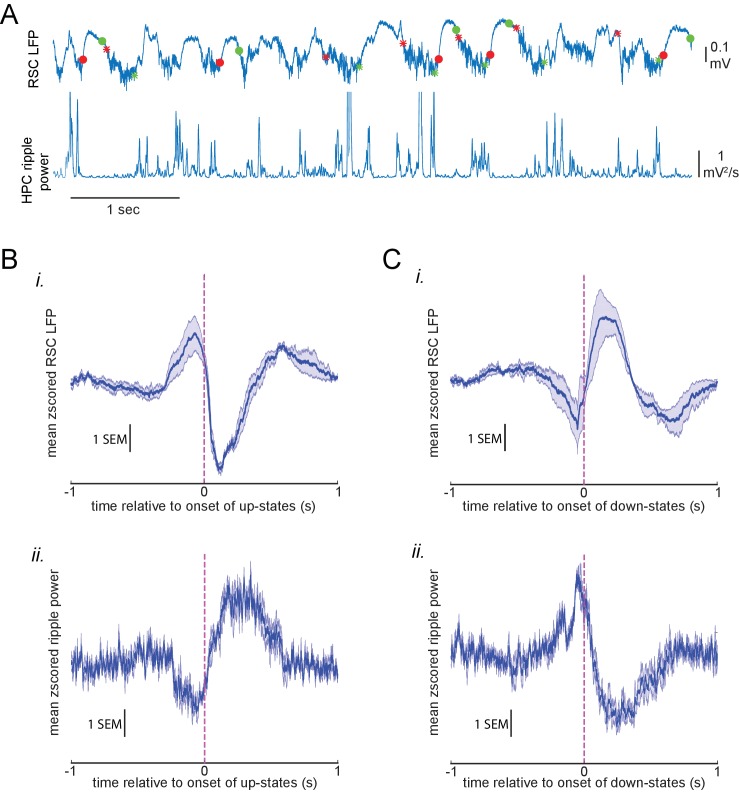
Figure 3. Ripple power is distinctively correlated with peak activity in different neocortical subnetworks.
(A) Representative montage (50 ms intervals) showing spatiotemporal pattern of mean hippocampal ripple power fluctuations around the peak of neocortical activations. 0s-time indicates peak activation time in each neocortical pixel. Color bar represents the mean z-scored ripple power associated with peak activation in a given neocortical pixel. (B) (i–ii) A representative frame showing the spatial distribution of ripple power at neocortical peak activation time. Colored squares represent three regions of interest (retrosplenial, visual, and forelimb somatosensory cortices in blue, black and magenta, respectively) for which their associated ripple power traces are displayed in (ii). (C) (i) Illustration of how the ripple power amplitude was quantified. Ripple power amplitude was defined as the mean ripple power signal across full-width at half maximum (t1 to t2). (ii) Grand average (n = 14 animals) of mean hippocampal ripple power amplitudes across neocortical subnetworks shown in Figure 2Ci, sorted in decreasing order. Each data point is the average of hippocampal ripple power amplitudes associated with all the regions in a given subnetwork and in a given animal. Bar graphs indicate mean ± SEM. (repeated measure ANOVA with Greenhouse-Geisser correction for sphericity: F3,39 = 14.172, p=1.8183 × 10⁻⁵; post-hoc multiple comparison with Tuckey’s correction: medial vs visual p=0.99476, medial vs auditory p=0.073032 [p=0.0152 without Greenhouse-Geisser correction], medial vs somatomotor p=0.00054029, visual vs auditory p=0.030248, visual vs somatomotor p=0.0010466, auditory vs somatomotor p=0.17794). This figure has two figure supplements.


