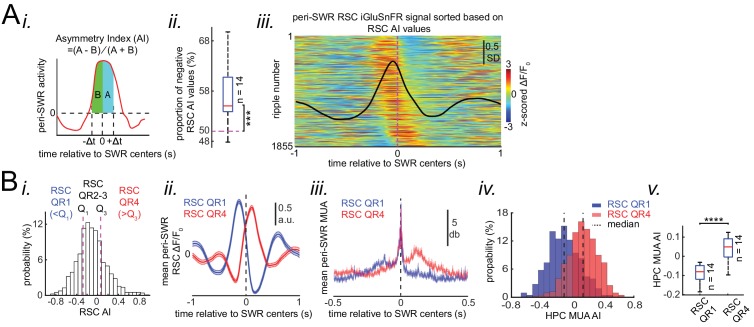
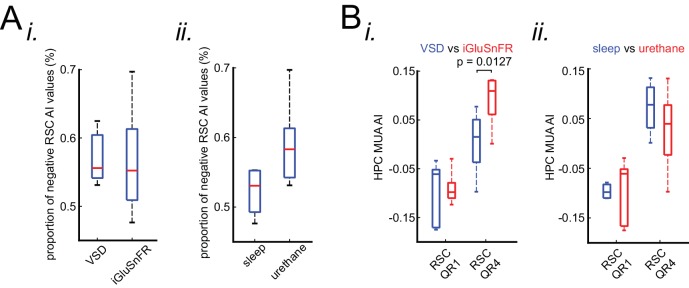
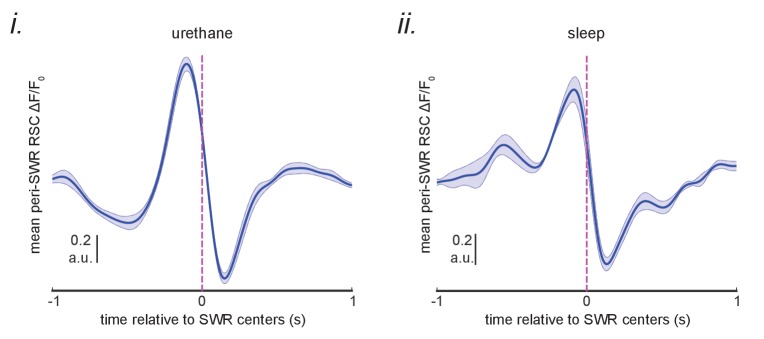
Figure 5. Neocortical activation latency relative to SWRs spans a wide spectrum of negative to positive values.
(A) (i) Schematic of Asymmetry Index (AI) calculation. In this figure, AI was calculated for individual peri-SWR retrosplenial cortex (RSC) traces and called RSC AI. RSC AI values were used to quantify the latency of neocortical activation relative to SWR timestamps. (ii) The proportion of negative RSC AI values across animals (n = 14). Magenta dashed line indicates the chance level (50%). 55% (median, indicated by a red line) of peri-SWR RSC activity across animals have negative AI, meaning that on average, neocortical tendency to activate prior to hippocampal SWRs is greater than chance (n = 14; one-sided one-sample Wilcoxon signed-rank test; the median is greater than 0.5 with p=1.831 × 10⁻⁴). (iii) Representative peri-SWR RSC activity sorted by AI calculated for each individual peri-SWR RSC trace. Color bar represents z-scored iGluSnFR signal. The black trace shows the mean peri-SWR RSC iGluSnFR signal. Note that the chance of neocortical activation preceding SWRs is higher than following them. (B) (i) Distribution of RSC AI values for a representative animal. Dashed lines indicate the first (Q1) and third quartiles (Q3). The SWRs for which the associated RSC AI values are less and greater than Q1 and Q3 are called RSC QR1 and QR4, respectively. RSC QR2-3 consists of all other SWRs. (ii) Example plots of mean peri-SWR RSC iGluSnFR signal associated with RSC QR1 (blue) and QR4 (red). The thickness of the shading around each plot indicates SEM. Note that the activity associated with RSC QR1 and QR4 peak before and after SWR centers, respectively. (iii) Time course of exemplar mean peri-SWR hippocampal MUA associated with SWRs in RSC QR1 (blue) and RSC QR4 (red). Notice that both hippocampal MUA activity and RSC iGluSnFR activity are negatively (negative AI) and positively (positive AI) skewed for RSC QR1 and QR4, respectively. (iv) Distributions of hippocampal MUA AI values for SWRs in RSC QR1 (blue) and QR4 (red) in a representative animal. The vertical line represents the median of each distribution. (v) Summary of median values calculated in (iv) across all animals (n = 14, one-sided paired Wilcoxon signed-rank test; RSC QR1 versus RSC QR4 p=6.103 × 10⁻⁵). This figure has three figure supplement.


