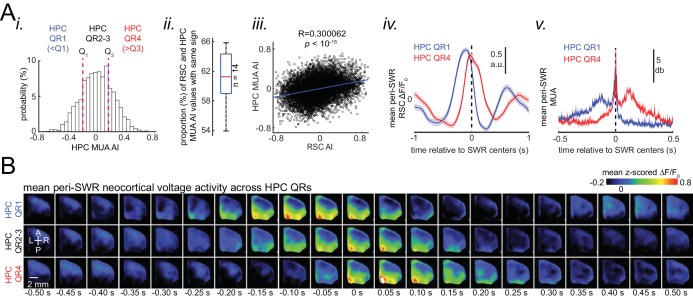
Figure 6. Skewness of peri-SWR hippocampal MUA informs neocortical activation latency relative to SWRs.
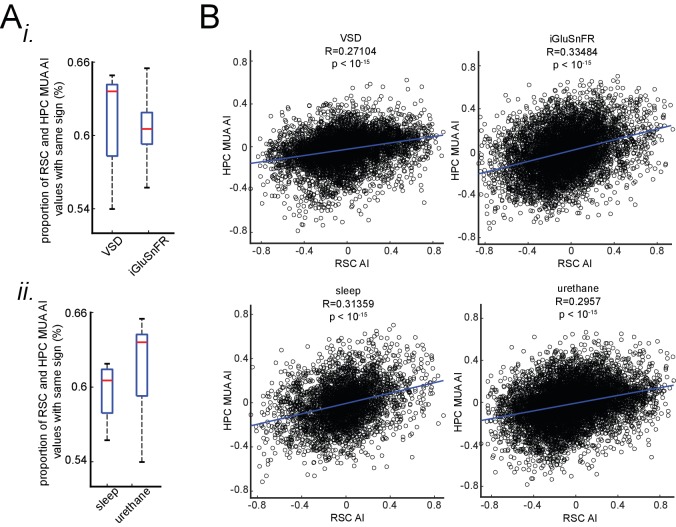
(A) (i) Distribution of hippocampal MUA AI values for a representative animal. Dashed lines (Q1 and Q3) indicate the first and third quartiles. The SWRs for which the associated hippocampal MUA AI values are less than Q1 and greater than Q3 are called HPC QR1 and QR4, respectively. HPC QR2-3 consists of all other SWRs. (ii) Distribution of the proportion of SWRs in each animal for which the sign of both RSC and hippocampal MUA AI values match, as an indication of how well hippocampal MUA can inform whether RSC activity precedes or follows SWRs. The horizontal red line indicates the median of all proportion values in n = 14 animals (significantly above the chance level of 50%; two-sided Wilcoxon signed rank test p=1.220703125 × 10⁻⁴). (iii) Correlation between the RSC and hippocampal MUA AI values pooled across all animals (14 animals) is low but significant (n = 11725 SWRs across all animals; two-sided t-test p<10−15). (iv) Example plots of mean peri-SWR RSC glutamate activity associated with HPC QR1 (blue) and QR4 (red). (v) Time course of exemplar mean peri-SWR HPC MUA traces associated with SWRs in HPC QR1 (blue) and Q4 (red). Notice that both HPC MUA activity (v) and RSC glutamate activity (iv) are negatively skewed (negative AI) for HPC QR1, and the converse is true for HPC QR4. (B) Mean neocortical voltage activity centered on SWR centers associated with HPC QR1, QR2-3, and QR4 in a representative animal. Note the relative temporal shift in activity across three quartile ranges. This figure has two figure supplement.


