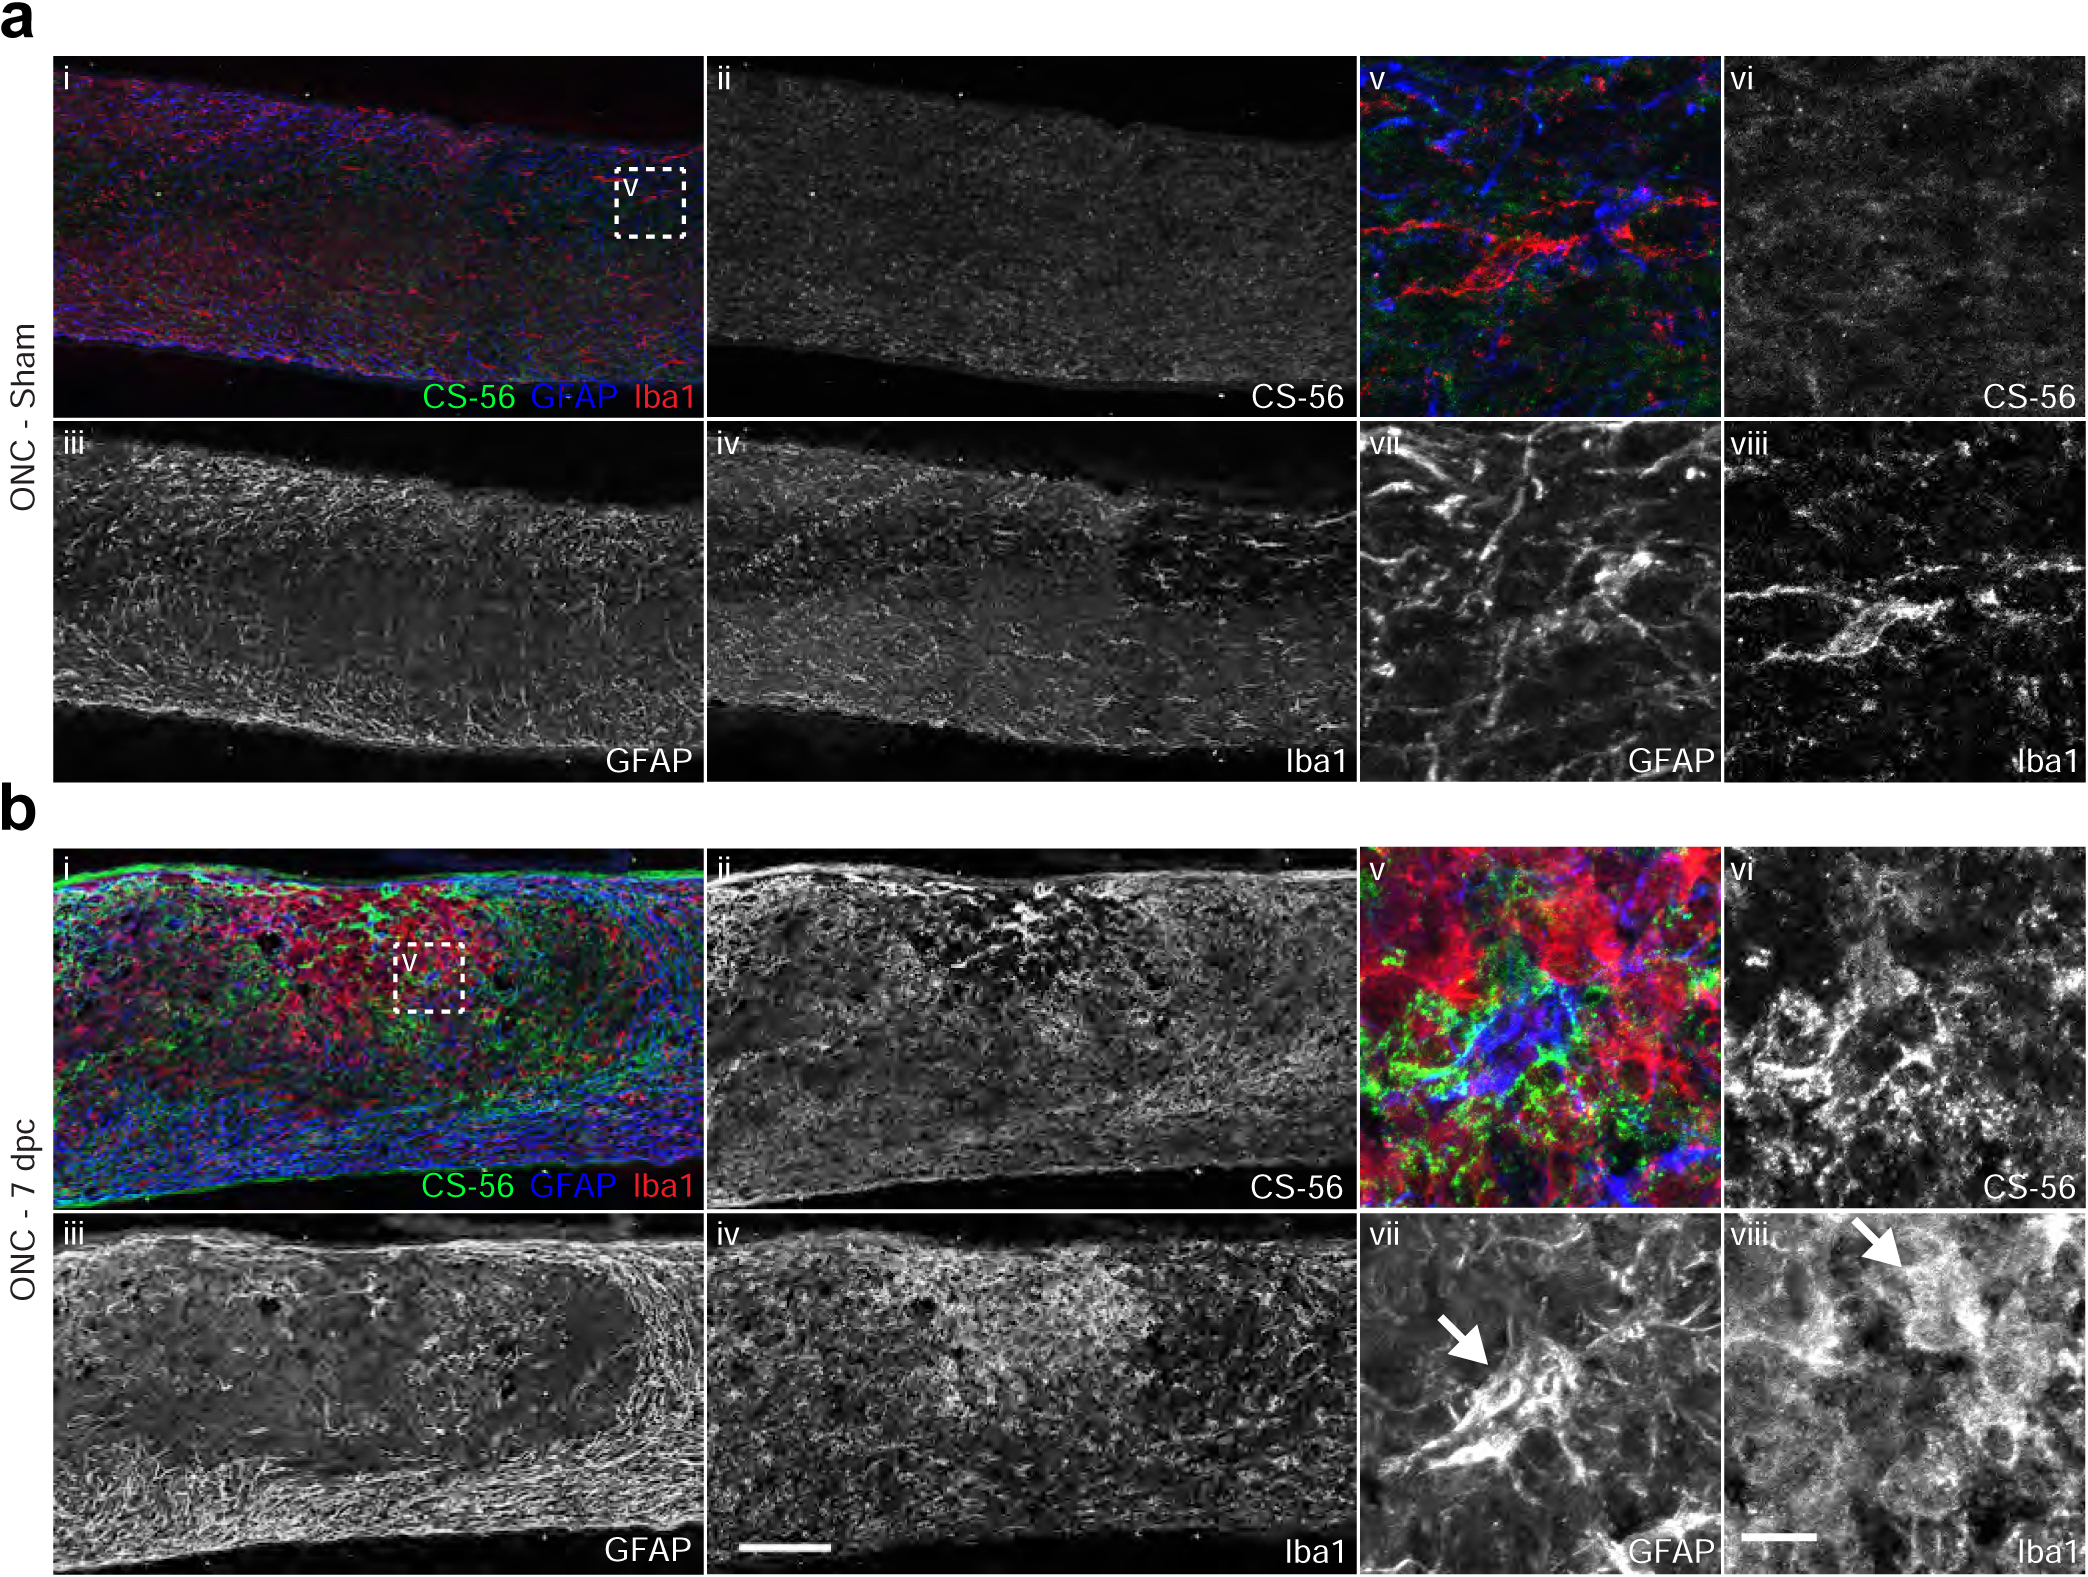
Fig. 4.

Elevation of CSPGs corresponds to peak of astrogliosis. Micrographs showing (a) sham or (b) 7 dpc mouse optic nerve tissue analyzed by immunohistochemistry with antibodies detecting reactive astrocytes (GFAP), activated microglia and macrophages (Iba1), and CSPGs (CS-56). Arrows indicate GFAP+ astrocytes (b-vii) and Iba1+ microglia (b-viii). Scale bar = 100 μm, insets = 10 μm.
