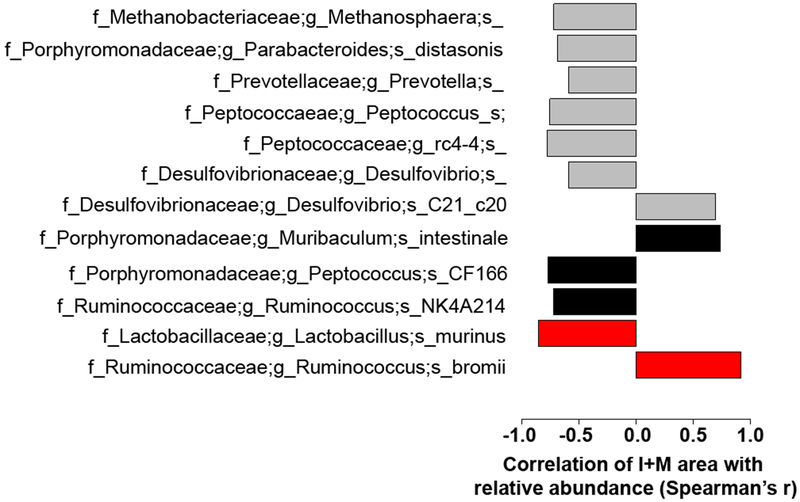
Fig 7.
Benjamini-Hochberg multiple comparison corrected Spearman’s r correlations of specific OTUs and subOTUs with average I+M area with FDR P<.05. Gray bars indicate correlations at the OTU level, black at the subOTU level as defined by DADA2 denoised, Basic Local Alignment Search Tool (BLAST) assigned individual sequence variants, and red at the subOTU level only comparing within groups of SD rats. All other correlations are across all rat groups.

