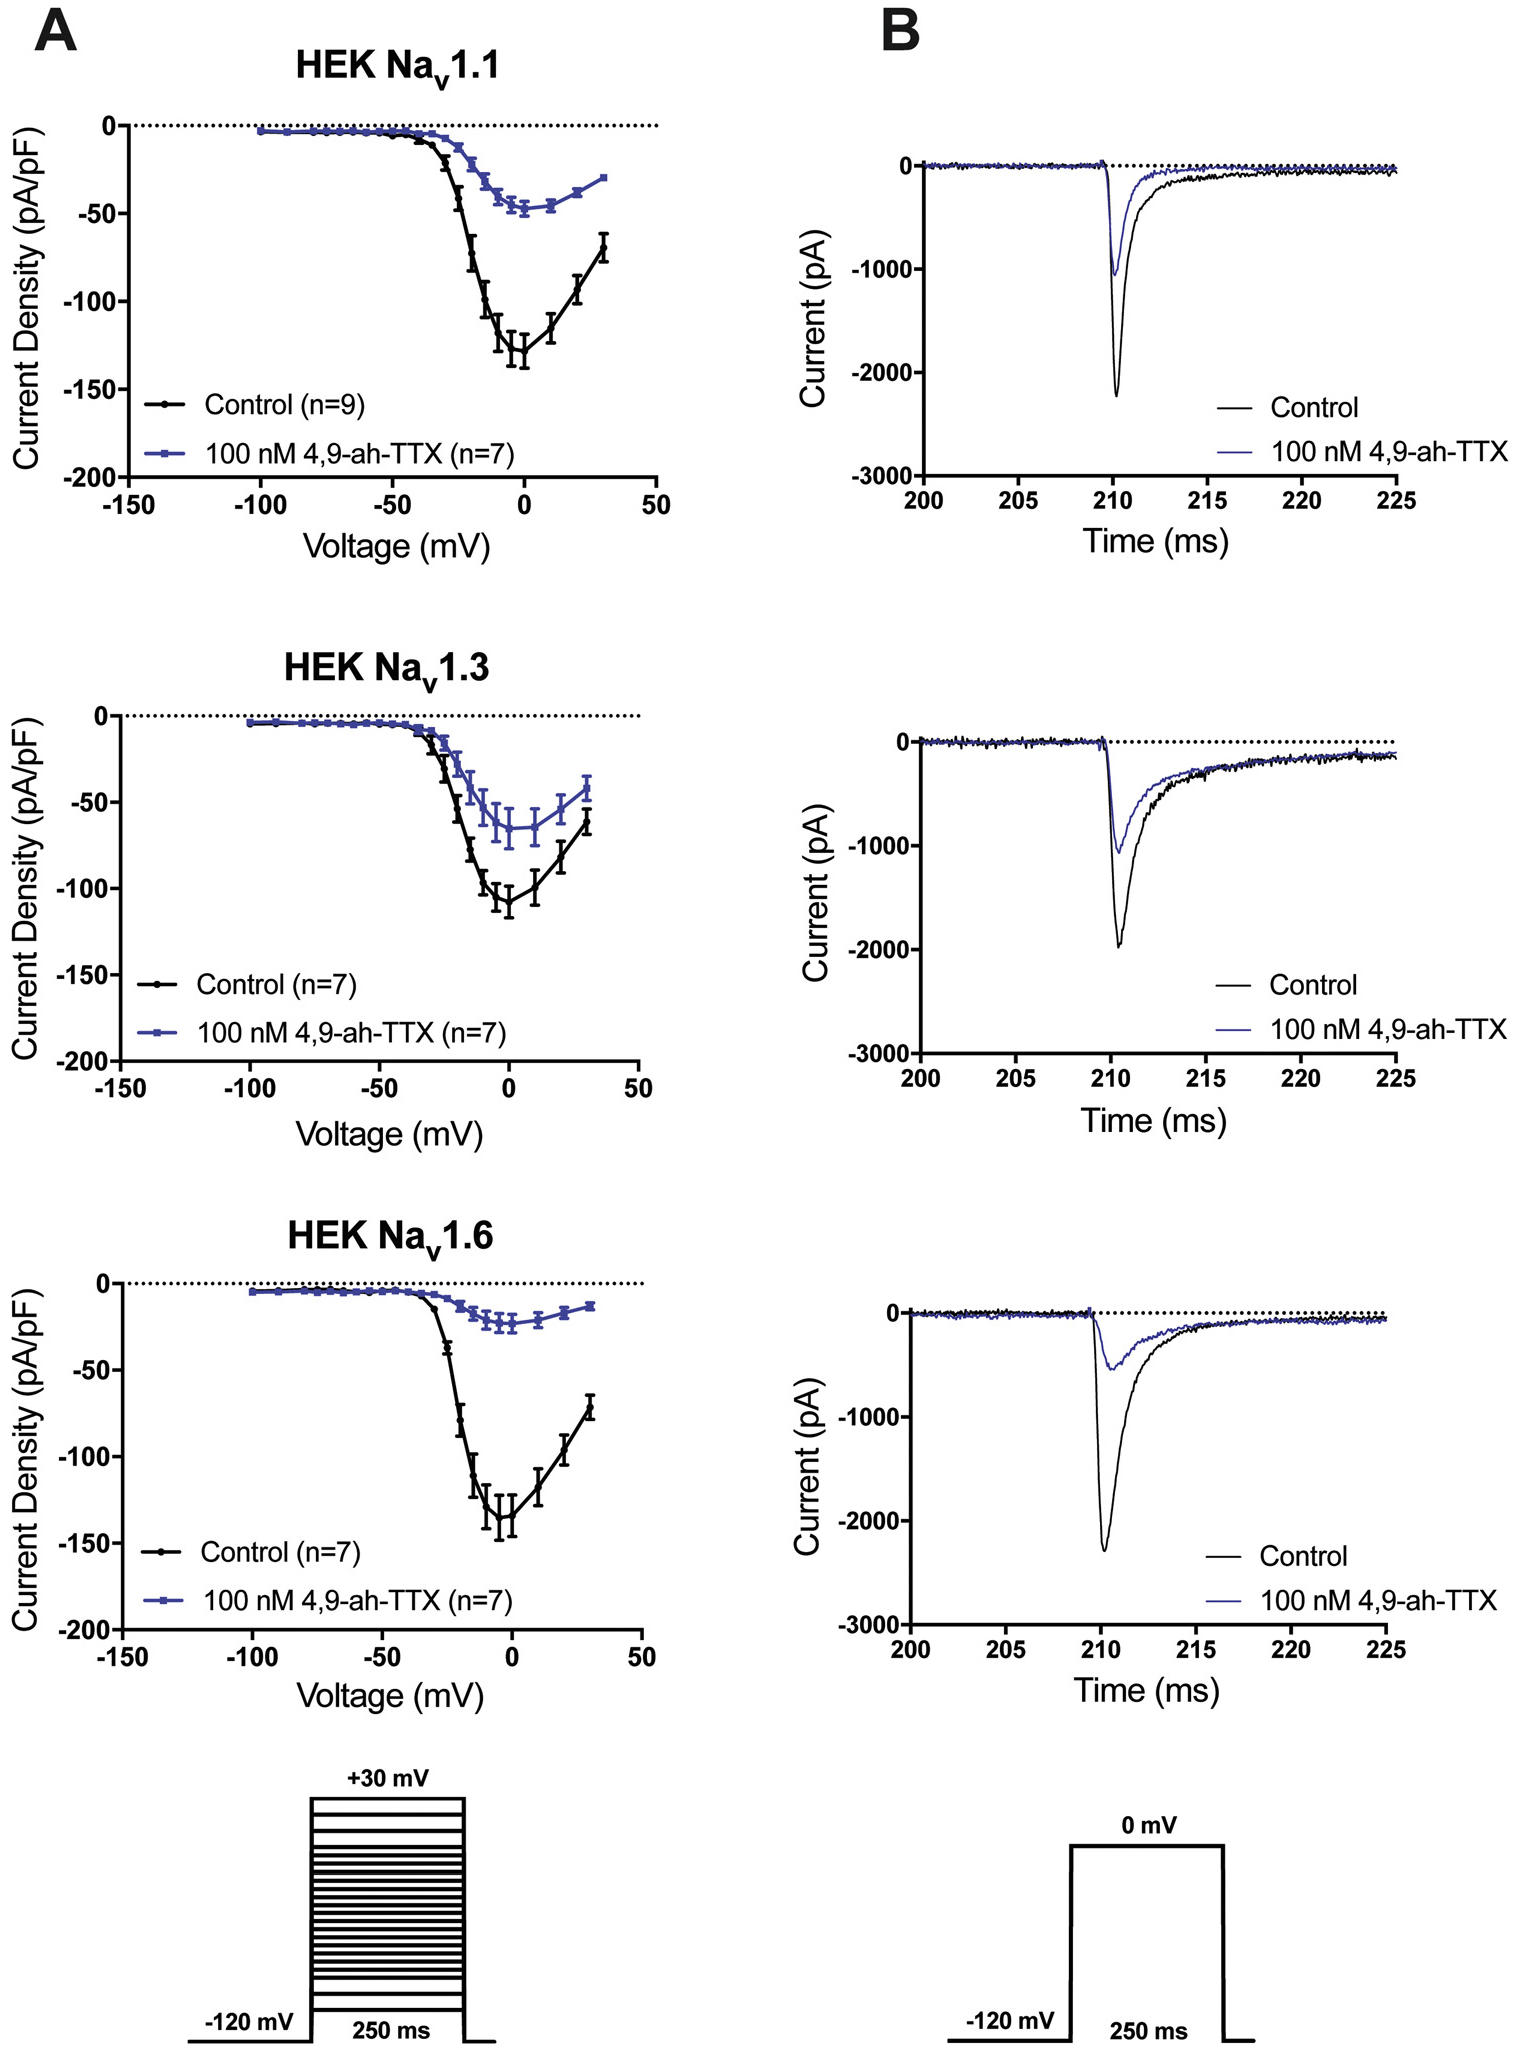
Fig. 2.

Nav1.1, Nav1.3 and Nav1.6 I-V curves and INa traces in the presence and absence of 100 nM 4,9-ah-TTX. (A) Current-voltage (I-V) relationship obtained from recordings in the presence and absence of 100 nM 4,9-ah-TTX via whole-cell patch clamp of HEK cells stably expressing human Nav1.1, Nav1.3 or Nav1.6. INa was evoked by stepping to different 250 ms test pulses in 5–10 mV intervals. Peak INa was normalized to cell capacitance to obtain current density. Values represent the mean ± S.E. (B) Representative peak INa traces recorded in the presence of 100 nM 4,9-ah-TTX and absence (control) via whole-cell patch clamp from HEK cells stably expressing Nav1.1, Nav1.3 or Nav1.6. Cells were voltage-clamped at −120 mV and peak INa was elicited via stepping to a test pulse of 0 mV for 250 ms.
