
Fig. 3.
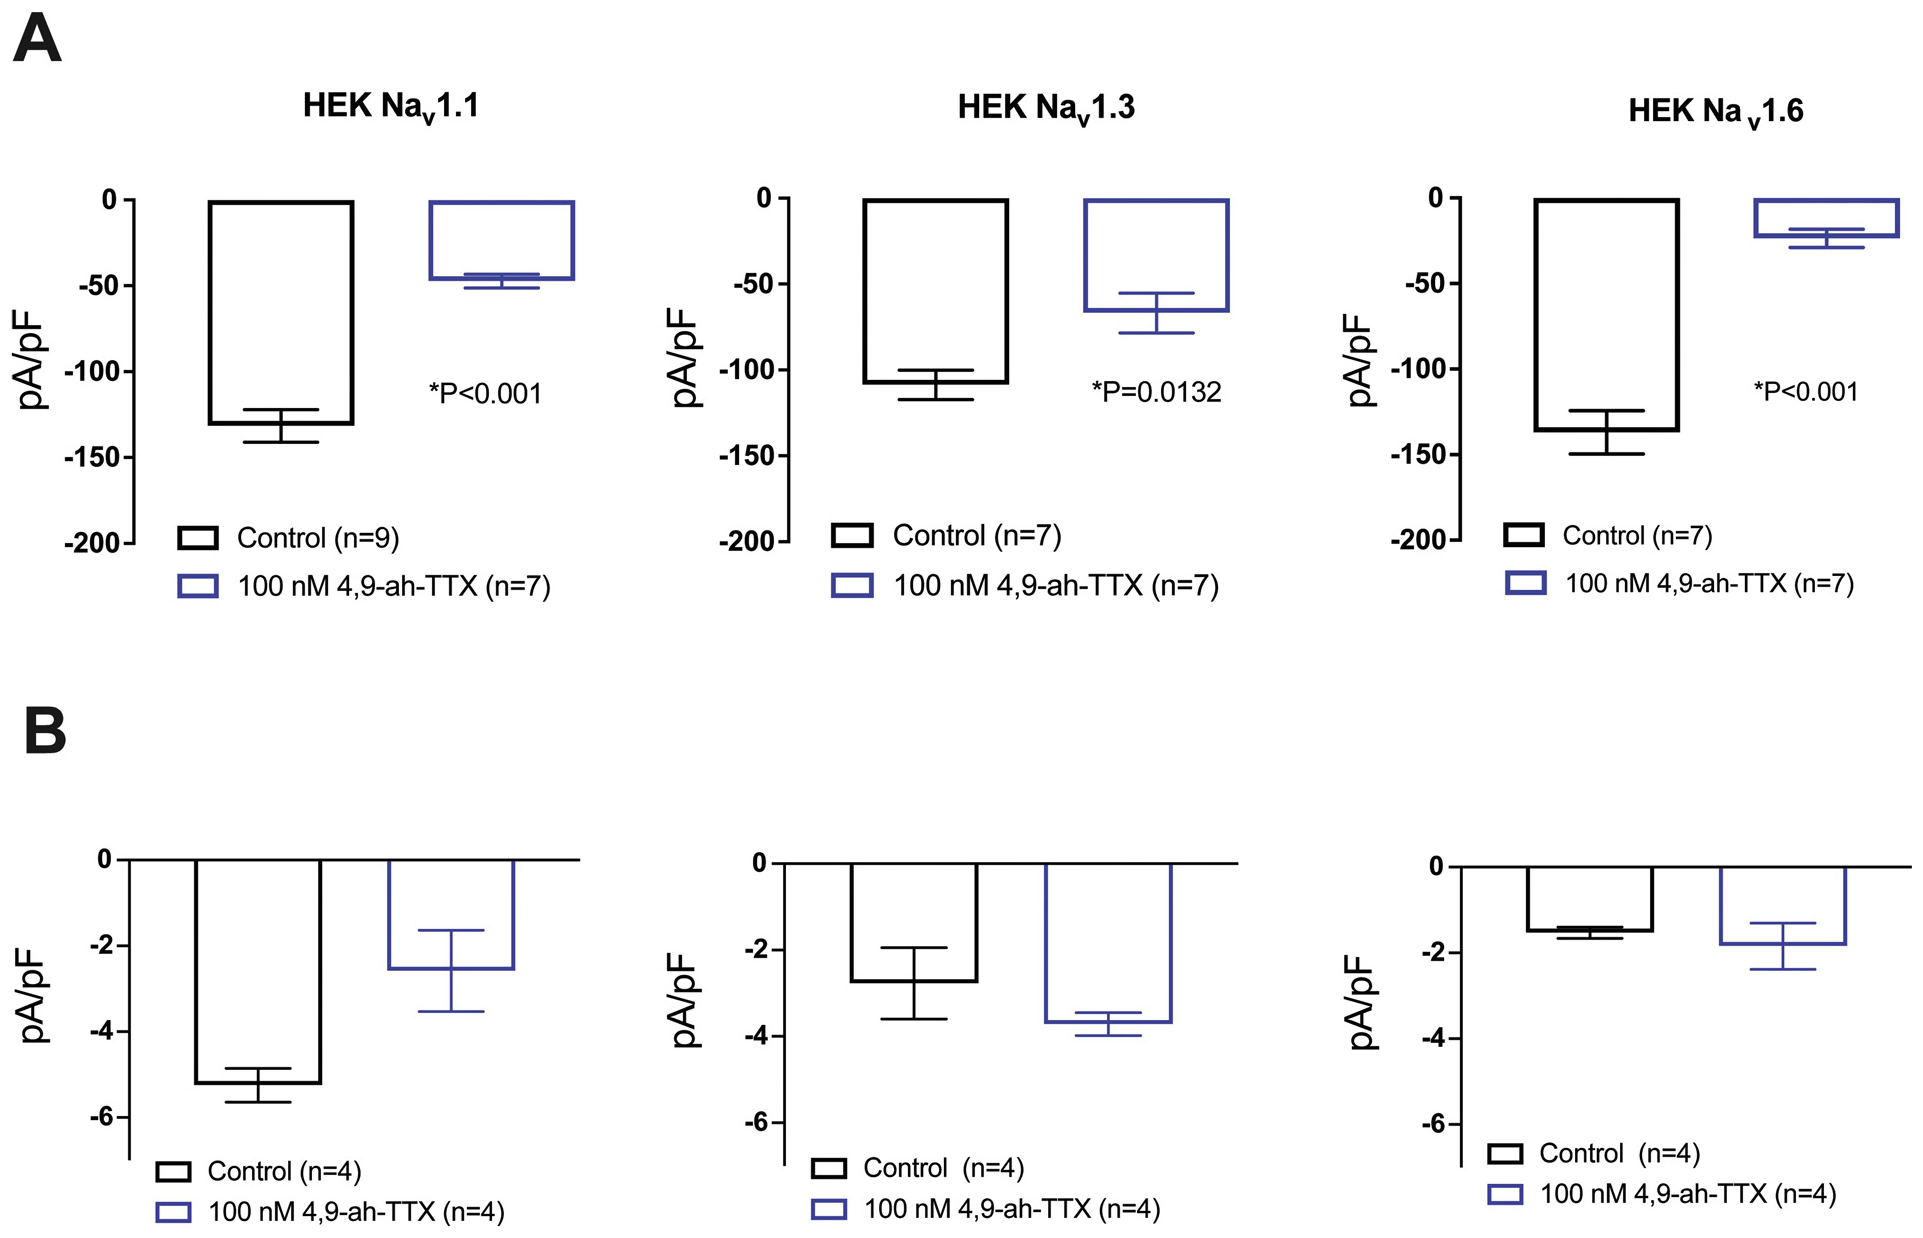
Average peak and persistent INa density recorded in the presence and absence of 100 nM 4,9-ah-TTX in HEK cells stably expressing human Nav1.1, Nav1.3 or Nav1.6. (A) Cells were voltage-clamped at −120 mV and peak INa was elicited via stepping to a test pulse of 0 mV for 250 ms. (B) Persistent INa density present in a 2 ms time period 50 ms after peak INa was observed at a test pulse to 0 mV. Bar graphs represent mean ± S.E. Significant differences between control and toxin treated conditions were tested using a Student’s unpaired t-test. Data obtained from recordings depicted in Fig. 2.