Figure 1.

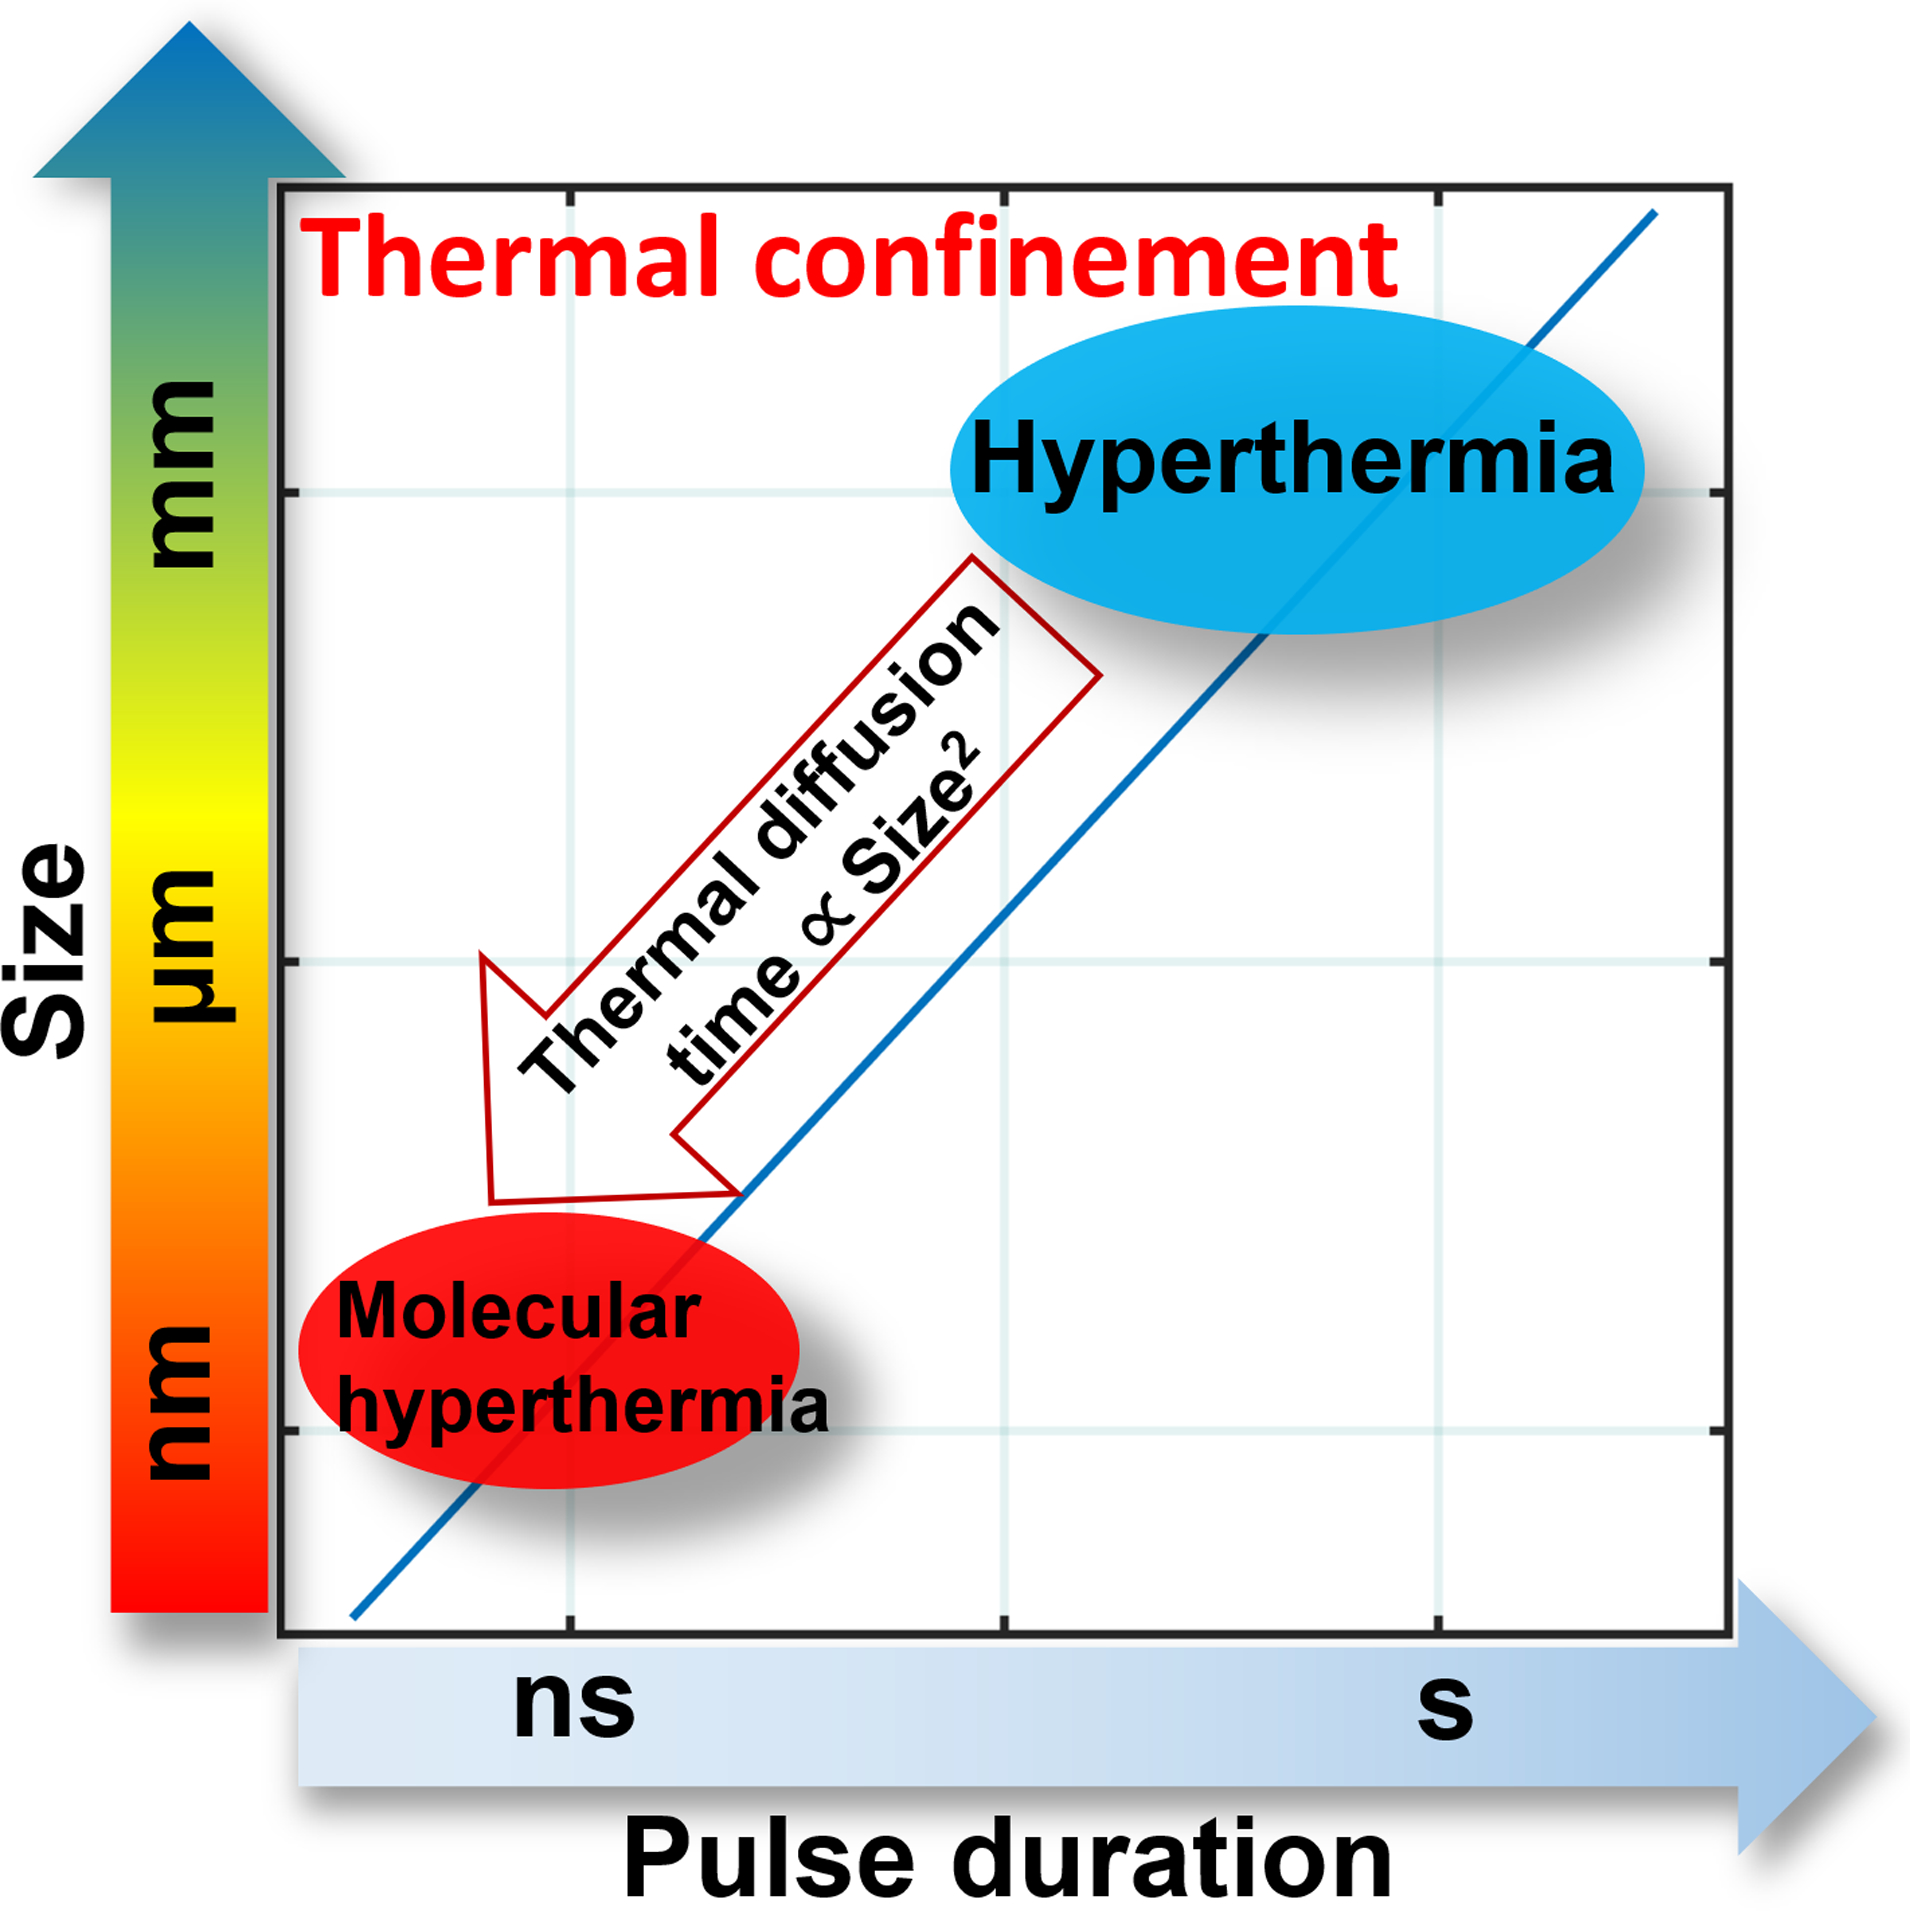
Schematic to illustrate the time and length scales of molecular hyperthermia (MH) compared with hyperthermia. Area left of the line represents thermal confinement. The thermal diffusion time is proportional to the square of size.34

Schematic to illustrate the time and length scales of molecular hyperthermia (MH) compared with hyperthermia. Area left of the line represents thermal confinement. The thermal diffusion time is proportional to the square of size.34