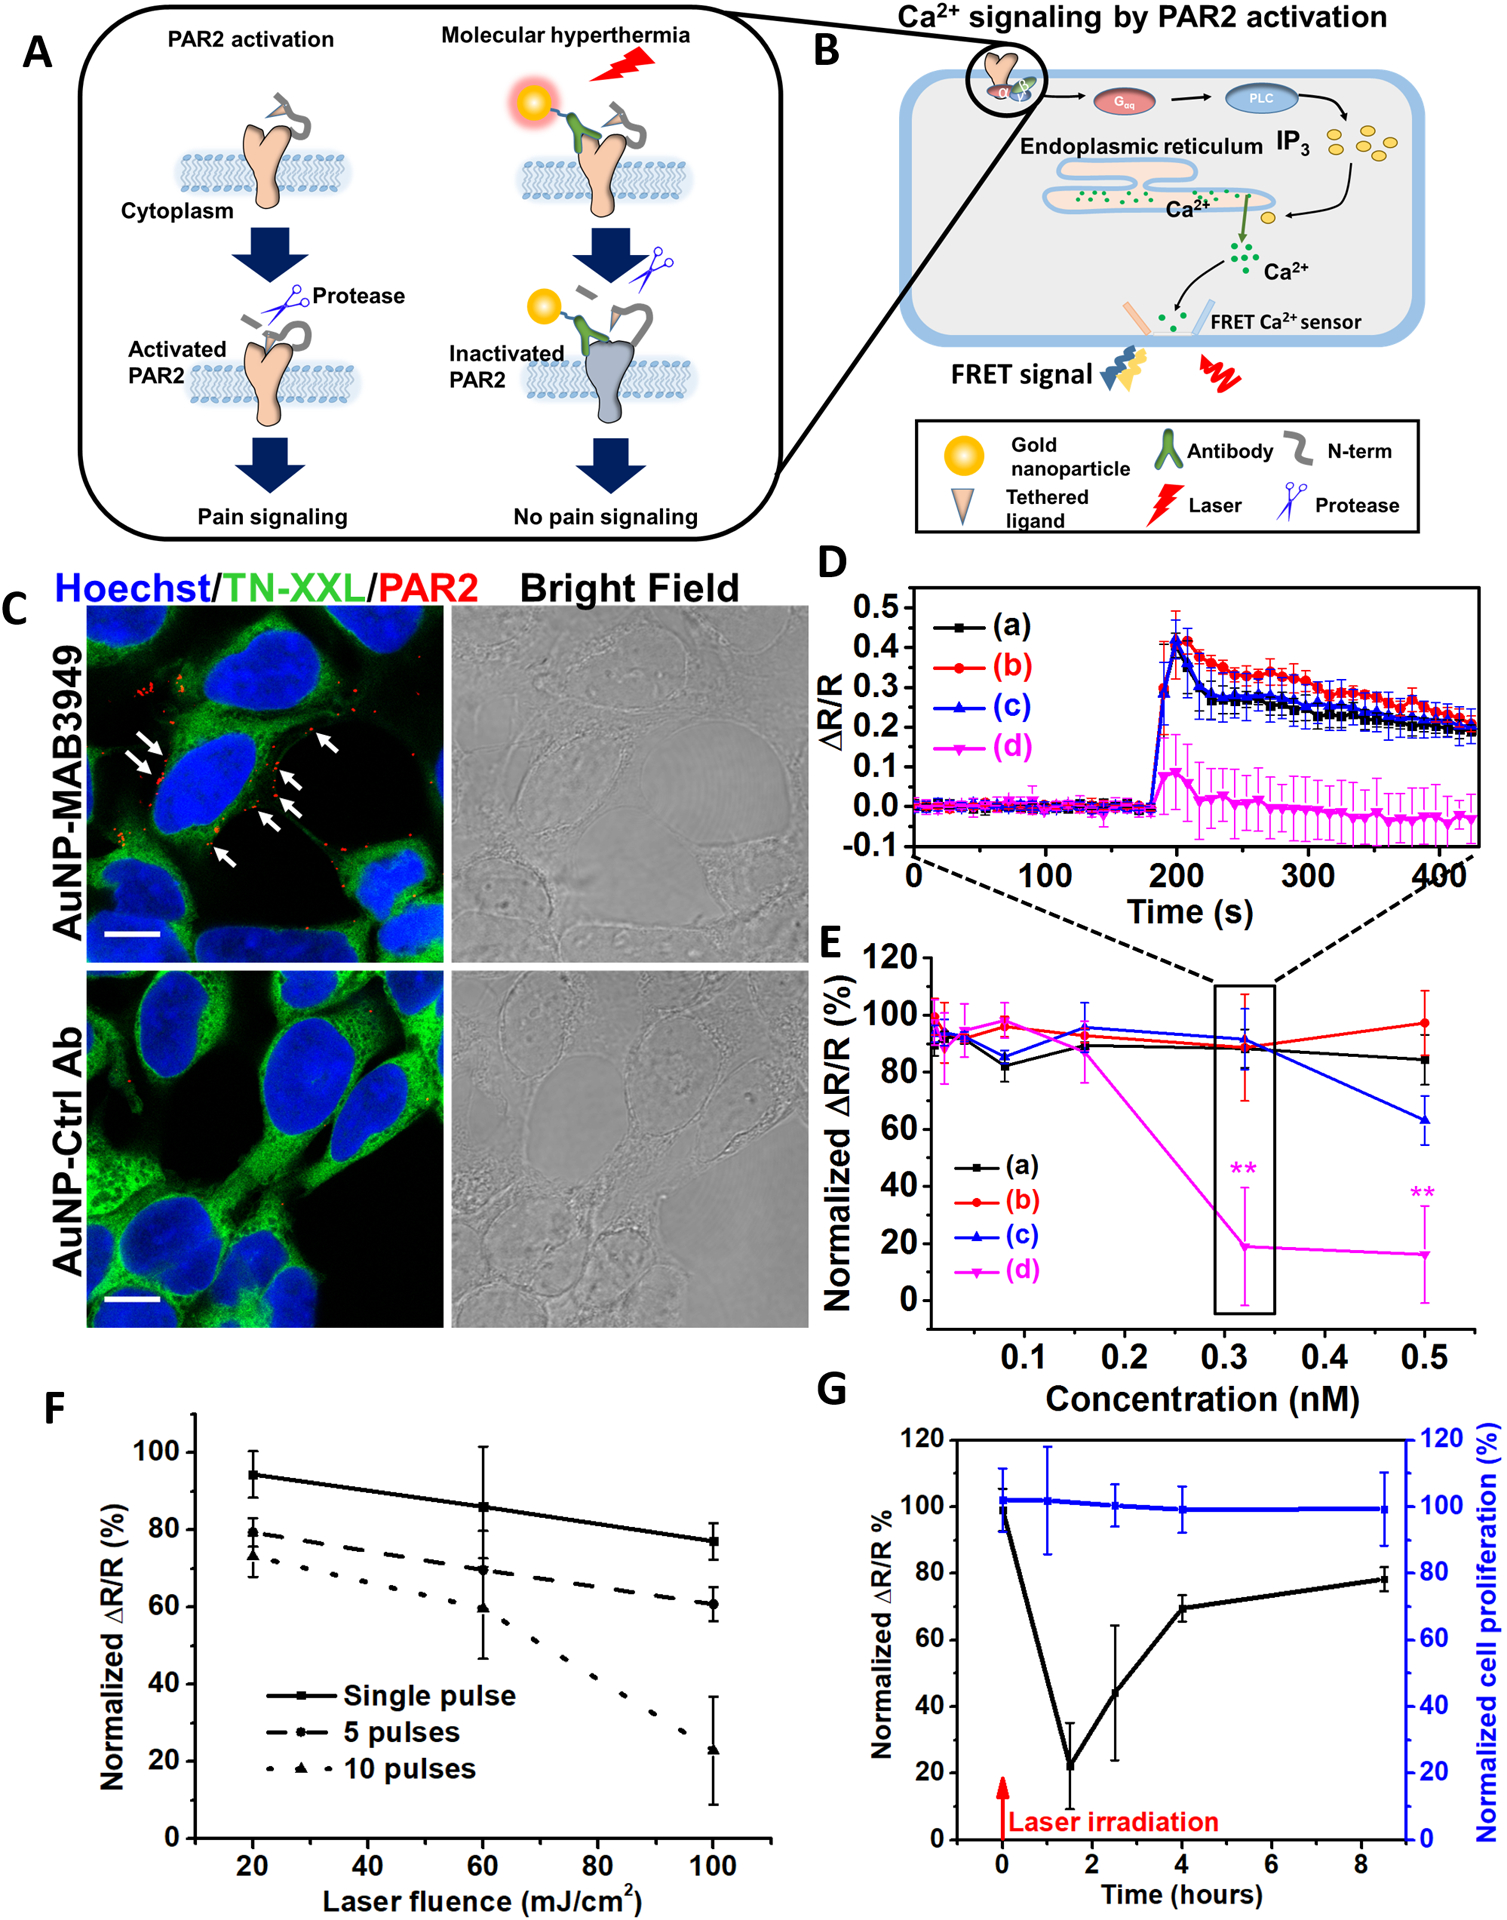
Figure 2.

Photo-inactivation of PAR2 by molecular hyperthermia. A) Schematic of PAR2 inactivation by molecular hyperthermia. B) Schematic illustrating the Ca2+ signaling due to PAR2 activation. Gαq is heterotrimeric G protein subunit, PLC is phospholipase C, IP3 is inositol trisphosphate. C) Fluorescent immunocytochemistry imaging of HEK293 cells. Nucleus is in blue (Hoechst 33342), FRET Ca2+ sensor protein TN-XXL is in green, and PAR2-targeting antibody modified gold nanoparticle (AuNP-MAB3949) is in red (stained by Alexa 647 conjugated secondary antibody, indicated by white arrows), Control antibody modified gold nanoparticles (AuNP-Ctrl Ab) as a control show minimum signal (scale bar: 10 μm), AuNP concentration [AuNP] = 0.5 nM. D) The FRET ratio (ΔR/R) signal for different groups: (a) AuNP-Ctrl Ab, no laser; (b) AuNP-MAB3949, no laser; (c) AuNP-Ctrl Ab, with laser; (d) AuNP-MAB3949, with laser. [AuNP] = 0.32 nM. Laser conditions: 532 nm wavelength, fluence at 100 mJ/cm2 and 10 pulses. The incubation time for AuNPs is 5 minutes. E) Dose response of PAR2 activity under different particle concentrations for different groups. The groups are color-coded as in Figure 2D. F) Dose-response curve for PAR2 activity under different laser fluence and pulse numbers. [AuNP] = 0.32 nM and AuNP incubation time is 5 minutes. G) PAR2 function recovery and cell proliferation after molecular hyperthermia treatment. The experimental conditions are the same as (d) group in Figure 2D. Laser were irradiated at 0 hour time point (indicated by red arrow). The normalized ΔR/R and cell proliferation indicate normalization with the control group (without AuNP incubation or laser treatment).
