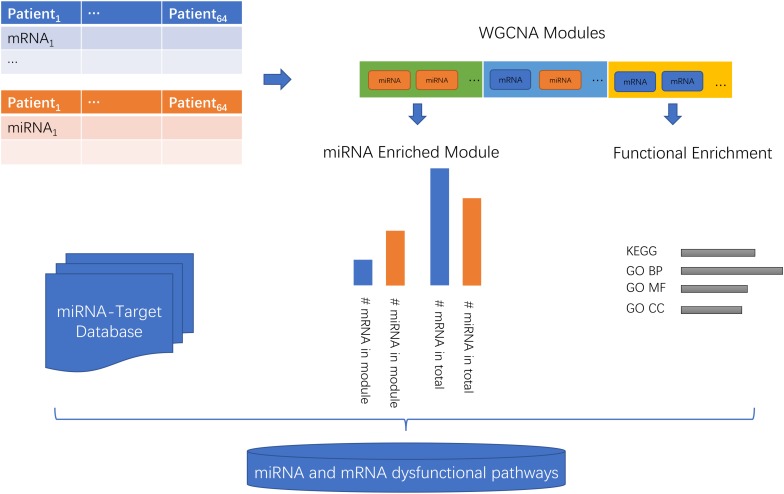
FIGURE 1.
The workflow of the miRNA and mRNA co-expression network analysis. First, the miRNA and mRNA profiles of the same patients were combined. Then, the WGCNA network was constructed and the genes/miRNAs were clustered into modules. Then, the KEGG (Kyoto Encyclopedia of Genes and Genomes) and GO (Gene Ontology) Biological Progress (BP), Molecular Function (MF), and Cell Component (CC) functions of each module were investigated. Then, the enrichment of miRNAs in each module was evaluated using a hypergeometric test which compared the proportions of miRNAs in this module and in the background of total mRNAs and miRNAs. Lastly, with the help of the miRNA-target database, we inferred the miRNA and mRNA dysfunctional pathways.

