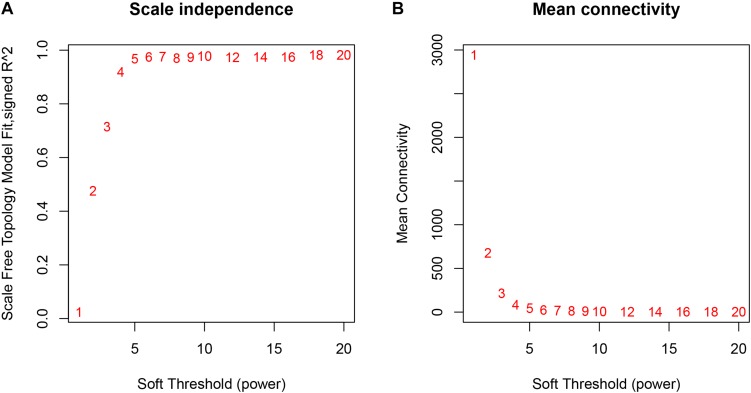
FIGURE 2.
The relationship between Soft Threshold (power) and network properties. (A) The relationship between Soft-Threshold (power) and Scale Free Topology; (B) the relationship between Soft-Threshold (power) and Mean Connectivity. When Soft-Threshold (power) was five, the Scale Free Topology (R2) was 0.967 and Mean Connectivity became stable. Therefore, we setted Soft-Threshold (power) to be five.

