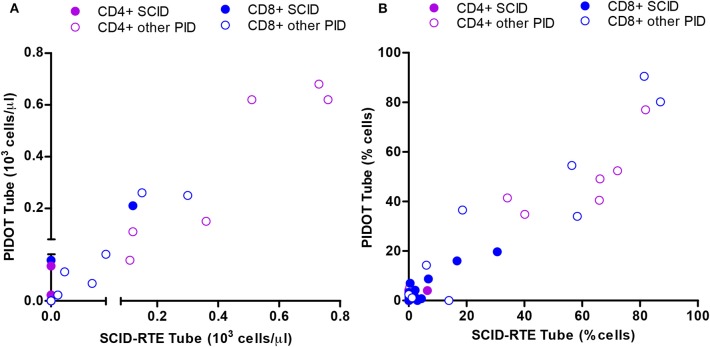
Figure 5.
Correlation between the SCID-RTE and the PIDOT tube in determining the levels of naïve CD4+ and CD8+ T-cell subsets in PID patients. (A) Absolute counts or (B) Relative counts for each PID patient (n = 24) of naïve CD4+ T-cells (blue) and naïve CD8+ T-cells (green) measured by the SCID-RTE tube (x axis) and the PIDOT tube (y axis). SCID (closed circles), other PID (open circles) patients. Detailed gating strategy is shown in Supplemental Figure 1.

