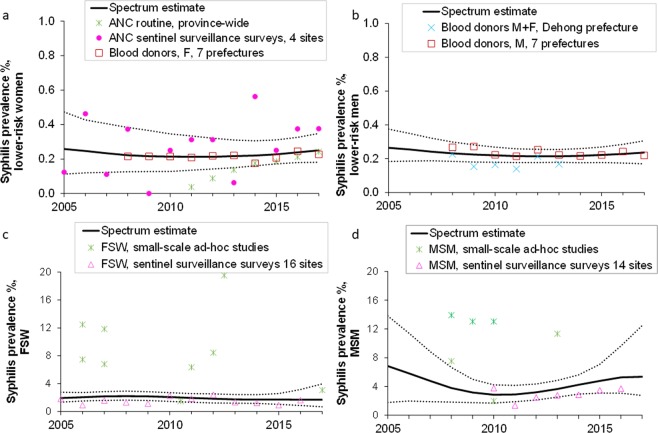
Figure 1.
Prevalence data and estimates for active syphilis, Yunnan province, 2005–2017: (a) Lower-risk women; (b) Lower-risk men: (c) Female Sex Workers; (d) Men who have sex with men. Prevalence estimates shown are after adjustment for diagnostic test performance. Solid lines are the best estimates; dotted lines the corresponding 95% confidence interval. The blood donor screening data that could not be disaggregated by sex; Table 1) were used in the estimation for lower-risk men, as this group had few other data available (panel b) and the majority of donors in this dataset (56%) were men. In contrast, they were not used in the estimation for lower-risk women, for whom there were many more data points (panel a).

