
Figure 2.
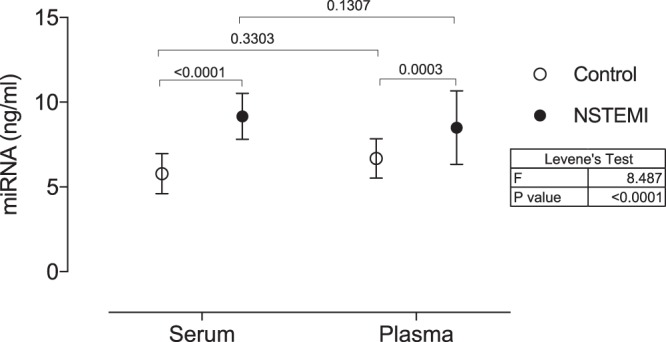
miRNA concentrations (ng/ml) in serum and plasma samples of NSTEMI patients in comparison to matched control determined by fluorometric quantitation. Data are shown as mean with 95% CI. P values of comparisons across the independent variables (blood sampling or myocardial infarction) are expressed on top of graphs. Variance across all groups (Levene’s test) is shown in the table next to the graph. Significance was considered when p < 0.05.