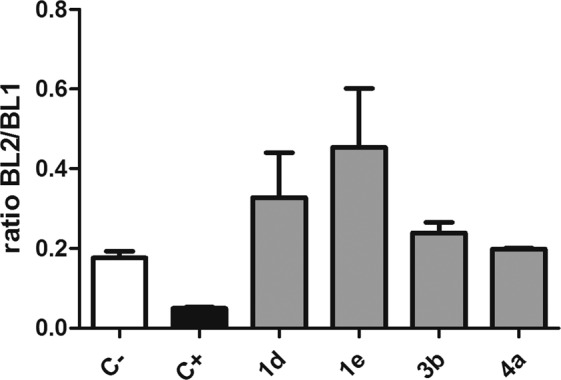
Figure 8.

Mitochondrial membrane potential analysis in T. cruzi trypomastigotes treated with compounds 1d, 1e, 3b and 4a for two hours labeled with JC-1 probe (0.2 μM). The fluorescence was measured in a flow cytometer (ATTUNE). Minimum (untreated – negative control, C−) and maximum (treated with CCCP- 100 µg/mL - positive control, C+) alterations in the mitochondrial membrane potential were obtained. Fluorescence was quantified by calculating the ratio between the channels BL2/BL1. One representative experiment of two assays is shown.
