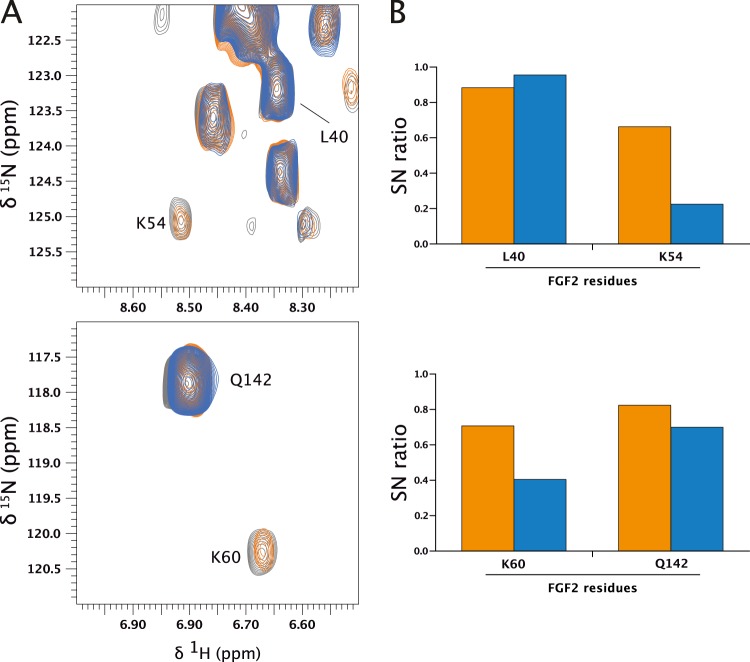
Fig. 4. NMR analysis of the interaction between FGF2-C77/95S and α1-subCD3.
a Shown are two regions of the overlay of 1H-15N-HSQC spectra of 77 µM 15N-labeled FGF2-C77/95S in the absence (gray) or presence of 70 µM (orange) or 138 µM α1-subCD3 (blue). b Signal-to-noise ratios (SN ratio) for indicated peaks of the spectra shown in a are plotted here with SN(+70 µM α1-subCD3)/SN(-α1-subCD3) in orange and SN(+138 µM α1-subCD3)/SN(-α1-subCD3) in blue.

