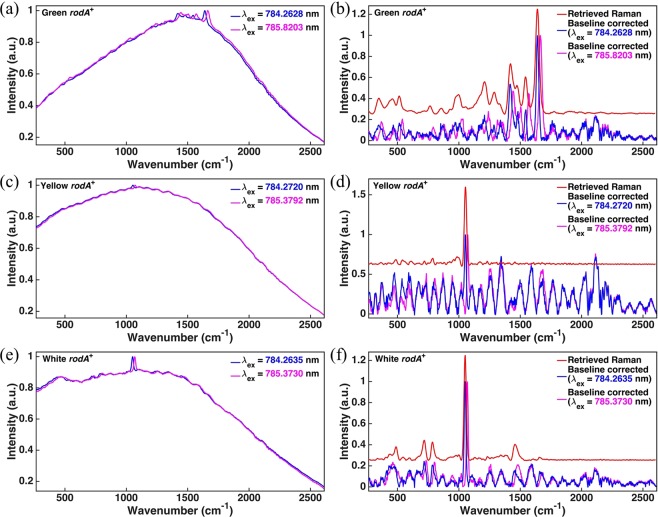
Figure 2.
Spectra of color phenotypes and the corresponding SERDS spectra. The top (a,b), middle (c,d), and bottom (e,f) rows correspond to green, yellow, and white color phenotypes, respectively. The left column (a,c,e) corresponds to raw measured spectra taken with two slightly different laser excitation wavelengths. The right column (b,d,f) shows the corresponding reconstructed Raman spectrum (top red curve in each frame) retrieved using the SERDS technique compared to spectra generated from a conventional Asymmetric Least Squares (AsLS) algorithm (bottom curves in each frame). For the baseline-corrected spectra, only those features in each spectrum that correspond to a Raman response are sensitive to slight changes in laser excitation frequency.

