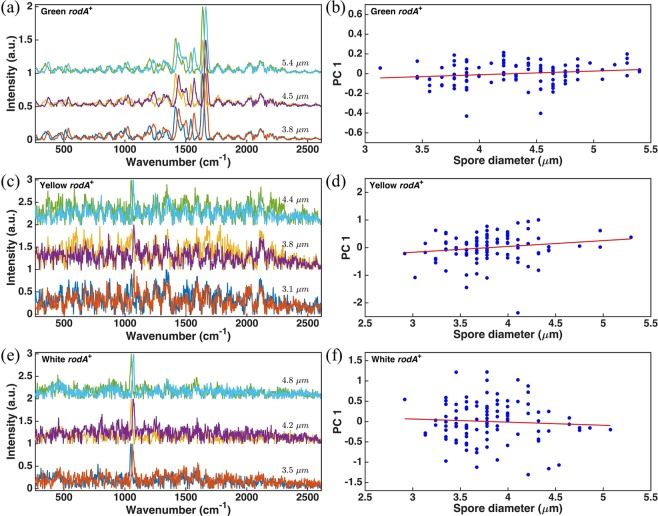
Figure 3.
The fine-scale fluorescence spectra of three color phenotypes with different spore diameters and the PC score of the first principal component of the fine-scale fluorescence of 100 conidia versus their diameters. The numbers above the curves in (a,c,e) are the measured diameters of the corresponding spores. In order to increase the signal-to-noise ratio, spectra in (c,e) are averaged over the spores whose diameters are within ± 0.1 µm of the listed diameter.

