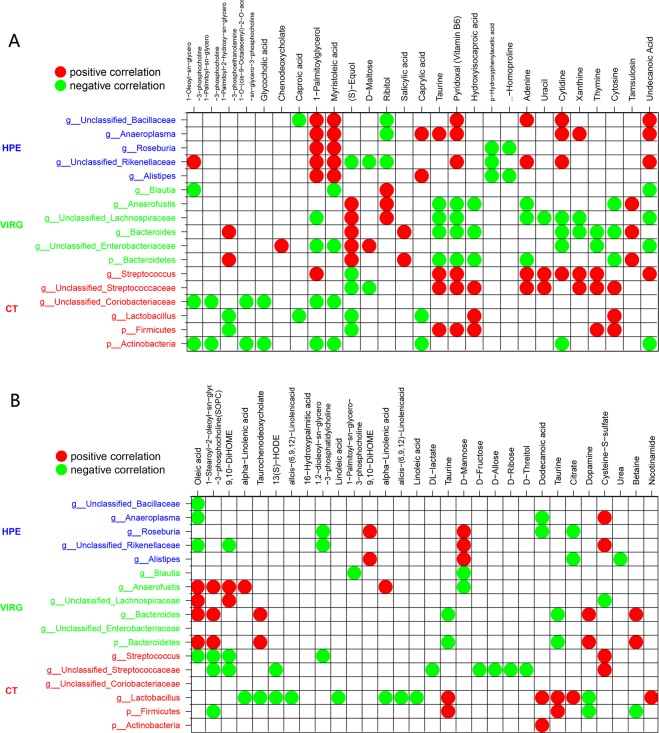
Figure 4.
Correlation between microbiota and metabolites in the cecum (A) and serum (B) of broiler chickens fed without or with dietary PEO or VIRG. The color was according to the Spearman correlation coefficient distribution. Red represented significant positive correlation (P < 0.05), blue represented significantly negative correlation (P < 0.05), and white represented that the correlation was not significant (P > 0.05). CT: the basal diet; PEO: the basal diet supplemented with plant extracts; VIRG: the basal diet supplemented with virginiamycin.

