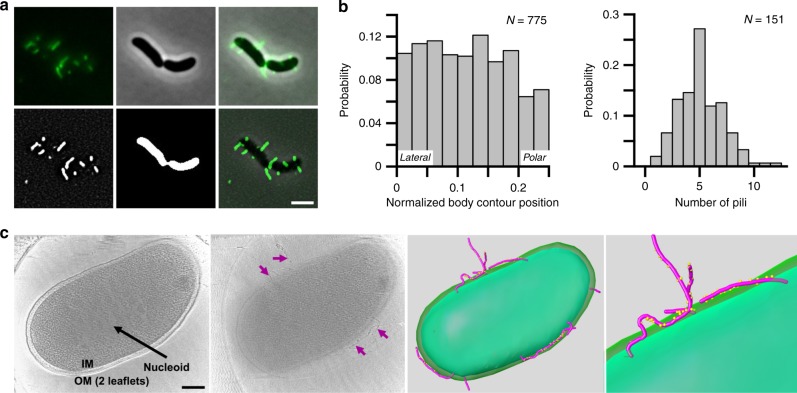
Fig. 1. MSHA pili are laterally localized along the cell body.
a Representative images of surface-associated mshAT70C cells labeled with AlexaFluor 488 C5 maleimide dye for visualization of MSHA pili. Raw images obtained are shown in: upper left panel—fluorescence channel, upper middle panel—phase-contrast channel, and upper right panel—overlay. Processed images shown in: lower left panel—filtered-fluorescence channel, lower middle panel—binary image of phase-contrast channel, lower right panel—overlay of filtered-fluorescence and phase-contrast channels. Images representative of three independent analyses. Scale bar = 2 μm. b Probability of pilus distribution (n = 775 single cells) on the cell surface observed, and distribution of the average number of pili per cell (n = 151 single cells) observed from agarose-pad associated cells. c Imaging the whole-cell suing Cryo-ET and 3D segmentation. Far Left Panel—The central slice of tomograms of mshAT70C whole-cell. Outer membrane two leaflets are visible. Nucleoid area is labeled in a white array. Middle Left Panel—Another slice from the same tomogram as shown in A, shows MSHA pili (marked with purple arrows) coated with the anti-MshA antibody. Middle Right Panel—3D segmentation of far left and middle left panels, with MSHA pili (purple) coated with anti-MshA antibody (yellow dots). Far Right Panel—Zoom-in image of 3D segmentation to show antibody-coating on the surface of pili. Colors same as in middle right panel. 3D segmentation performed from a single Cro-ET analysis, with Cryo-ET analysis performed on multiple individual V. cholerae cells. Scale bar = 200 nm.

