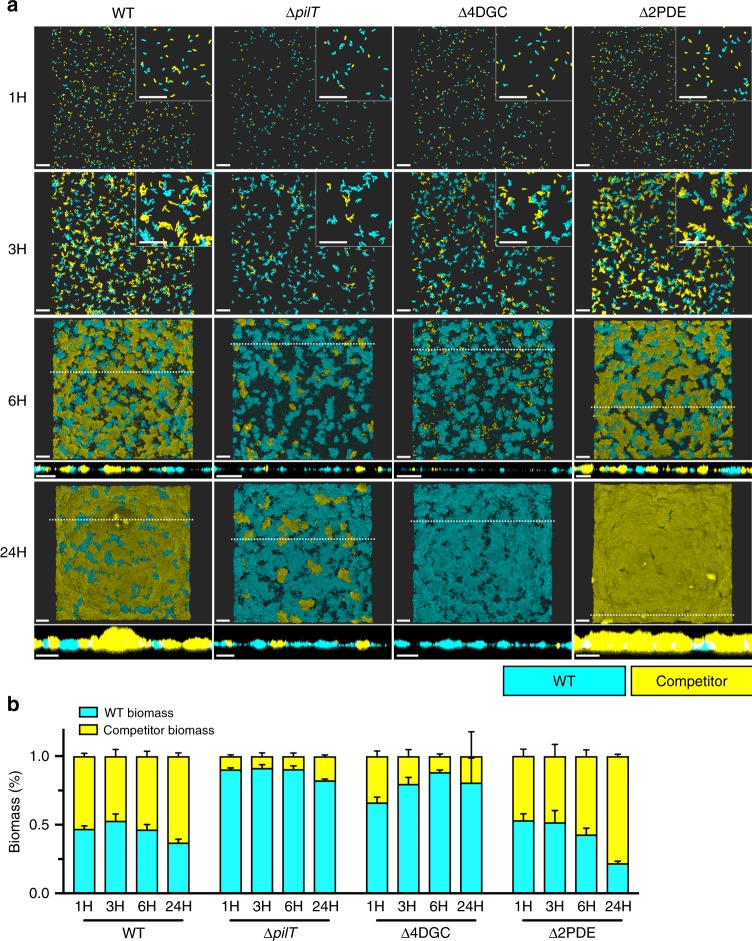
Fig. 7. MSHA extension and retraction dynamics dictate surface attachment and biofilm production in a model of competition.
a Representative images of flow cell biofilm competition experiments with WT::RFP (cyan) and WT::/mutant::GFP (yellow) strains, at stages corresponding to the monolayer stage (1 H), microcolony formation (3 H), three-dimensional microcolony development (6-H), and mature biofilm (24 H). Insets in the upper right corner of 1- and 3-h images are zoomed in views obtained from the same image to depict single cells and micro-colonies. Images at 6- and 24-h include a cross-sectional image of the XZ plane, and the position from which this cross-section was obtained is indicated in the image by the dashed-line. Images representative of 2 independent analyses. Scale bars = 20 μm. b WT::RFP (cyan) and competitor (WT::/mutant::GFP, yellow) biomass levels presented as a percentage of the overall biomass. Biomass levels determined using Comstat2, and the percentage of the GFP-biomass from the whole was determined at each time point and plotted as the mean from two biological replicates imaged at ×10 magnification (with three technical replicates per biological replicate and time point) with error bars indicating the standard error of the mean. Raw Comstat2 determined values are provided in Supplementary Table 1. Source data provided as a Source Data file.

