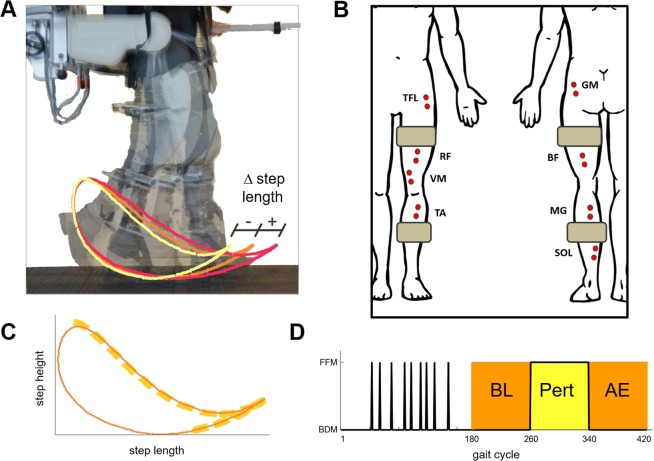
Figure 1.
Experimental setup. (A) Robotic system (Lokomat, Hocoma, Switzerland) used in the experiments and graphical representation of the effects of the two perturbations on the foot trajectory. The orange, red, and light-yellow lines represent the baseline foot trajectory pattern, the effect of the X perturbation, and the effect of the Xinv perturbation, respectively. The robot is attached to the leg via two cuffs located roughly in the middle of the thigh and shank. (B) Schematic representation of the position of the EMG electrodes used during the experiments. The grey rectangles represent the positions of the cuffs linking the leg with the robotic system. (C) Schematic representation of the foot trajectory during the experiment (continuous line) and portion of the cycle during which the robot produced a perturbation (i.e., mid-to-terminal swing phase of the gait cycle marked by the orange bold-dashed line). (D) Phases of the experiment. During the habituation period (first 180 gait cycles), the system was operated in Back-Driven Mode (BDM) except for 9 Force-Field Mode (FFM) single-step perturbations randomly distributed in time. The rest of the experiment consisted of 80 BDM gait cycles (baseline - BL), 80 FFM gait cycles (perturbation - Pert) and 80 BDM gait cycles (after effect - AE).

