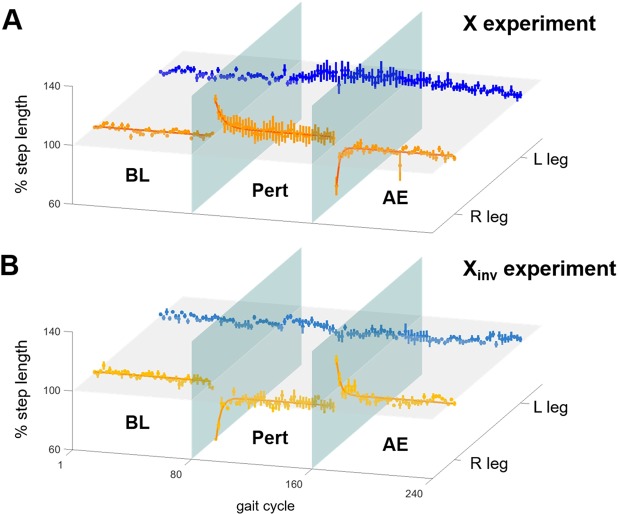
Figure 2.
Group analysis of adaptation in step length. Percentage changes in normalized step length during the BL, Pert and AE phases for the left (L) unperturbed (blue/light blue) and the right (R) perturbed (orange/yellow) legs. The data is shown for (A) the X and (B) the Xinv experiments. Each plot represents mean and standard error of the data across subjects. The bold lines shown for the right foot plots represent the exponentials (see Eq. 3, Materials and Methods) fitting the group data for the Pert and AE phases of the experiments. Lines were plotted for the BL phase of the experiments, at values equivalent to 100% step length. The horizontal plane corresponds to the 100% step length value, while the two vertical planes represent, respectively, the beginning and end of the Pert phase of the experiments. For the X perturbation (A) we observed a ~30% increase in step length of the perturbed leg at the beginning of the Pert phase. The corresponding plot shows an exponential adaptation. At the beginning of the AE phase, we observed a decrease in step length and a rapid return to BL step length. No significant changes were observed on the contralateral side. A mirrored behavior was observed in response to the Xinv perturbation (B).

