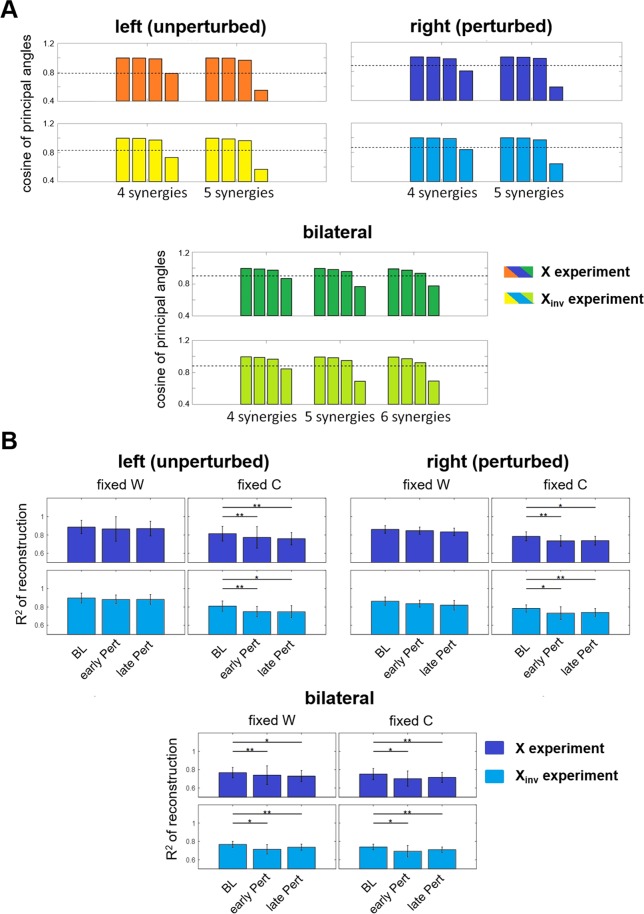
Figure 4.
Analysis of the dimensionality of the synergy subspaces. (A) Bar plots of the average - across subjects - cosines of the matched principal angles between the reference synergies (extracted from the gait cycles of the BL phase) and the synergies extracted unilaterally for both legs during the late-Pert phase (extracted from the last 5 segments, i.e., 10 gait cycles). Results obtained by comparing 4 and 5 unilateral (top plots) and 4, 5 and 6 bilateral synergies (bottom plots). The dotted line represents the threshold value obtained through surrogate data analysis (see Materials and Methods). For all the analyses, we observed a consistent shared subspace size. (B) Average and standard error - across subjects - of the R2 derived for the last 10 epochs of the BL phase and the first and last 10 epochs of Pert phase using the NMFFixedW and NMFFixedC algorithms. Results are shown for the unilaterally (top plots) and the bilaterally (bottom plots) extracted synergies. The p-values of Friedman’s ANOVA tests (significance level α = 0.1) are presented in each plot. Minimum Significance Difference tests showed significant differences across pairs (see Materials and Methods) as highlighted by the * symbol and the horizontal lines.

