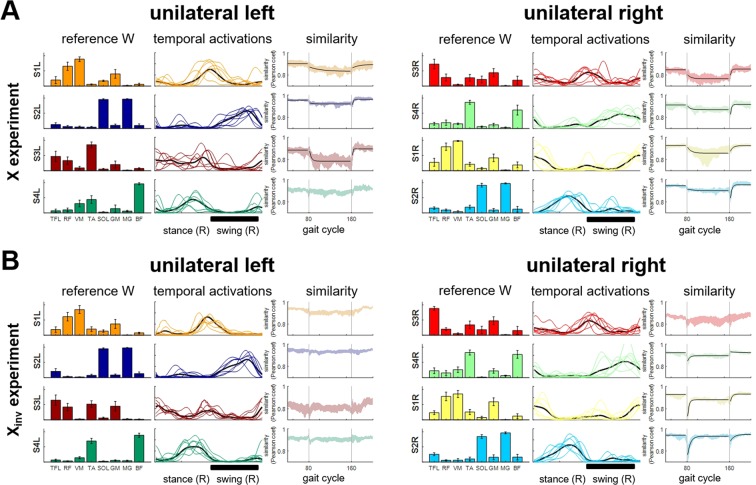
Figure 5.
Adaptation in the unilateral activation patterns of the synergies. Results obtained using the NMFFixedW algorithm on all the EMG epochs in the two experiments, (A) for X and (B) for Xinv. For each panel, each row shows the data for a different synergy (S#L for left side synergies, S#R for right side synergies). For each synergy, the plots (from left to right) show: (1) the average - across subjects - synergy reference modules; (2) the average - across epochs - temporal activation pattern during the last 10 gait cycles of Pert phase (thin colored lines), and the average - across segments and subjects - reference temporal activation pattern (bold black line), with a black bold line at the bottom of each set of plots representing the time interval when the force-field was active; and (3) the similarity (i.e., Pearson’s linear correlation coefficient) between the activation pattern of each epoch of the experiment and the reference activation pattern (that is the average of the epochs extracted during BL); the vertical grey lines represent the beginning and the end of the Pert phase. Black lines represent the exponential best fitting of the Pert and AE data. For the BL phase, the black lines represent the average similarity during BL. Exponential fitting was added only for the synergies for which it was possible to fit two exponential functions for the Pert and AE phases with a cumulative R2 > 0.75.

