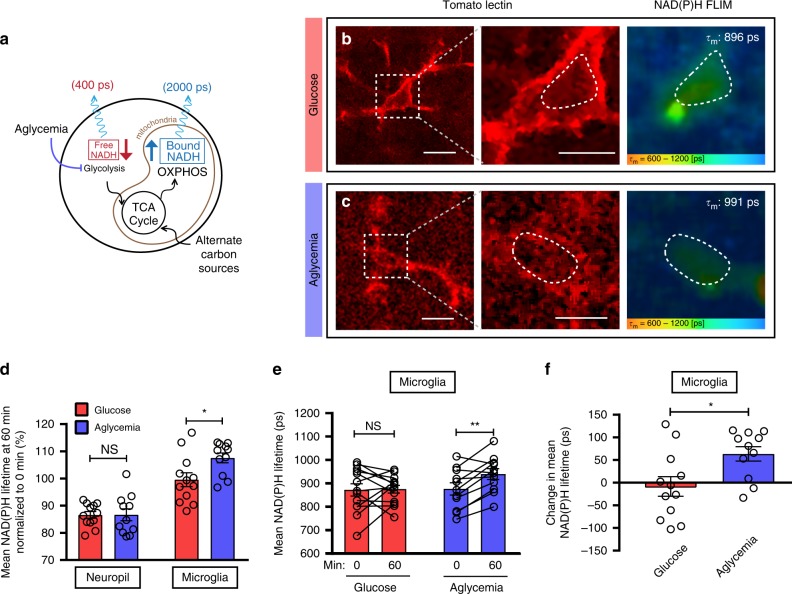
Fig. 4. Microglial metabolism is unaltered by aglycemia in situ.
a Schematic diagram showing the effect of aglycemia on free and bound NADH levels. b, c Representative images of FLIM-NAD(P)H imaging of microglia labeled with tomato lectin, following a 60-min incubation in glucose-containing aCSF (b) or aglycemic aCSF c. Indicated on the right panel is the mean NAD(P)H lifetime of the microglial ROI within the dotted line (for b–f, n = 4 mice, 12 microglia and surrounding neuropil for control, n = 4 mice, 11 microglia and surrounding neuropil for aglycemia). d Mean NAD(P)H lifetime of neuropil vs microglia, obtained 60 min after incubation in glucose-containing aCSF or aglycemic aCSF. Values are normalized to their respective baseline from t = 0. (NS, p > 0.05; *p = 0.0204, unpaired, two-tailed t-test). e Mean NAD(P)H lifetime of microglia from 0 to 60 min when incubated in either glucose-containing aCSF or aglycemic aCSF (NS, p > 0.05; **p = 0.0027, paired, two-tailed t-test). f Relative change in mean NAD(P)H lifetime of microglia over 60 min of treatment (*p = 0.0158, unpaired, two-tailed t-test). Data are represented as mean ± SEM. Scale bars, 10 μm (b, c, left panels); 5 μm (b, c, middle panels). Source data are provided as a Source Data file. See also Supplementary Fig. 3.

