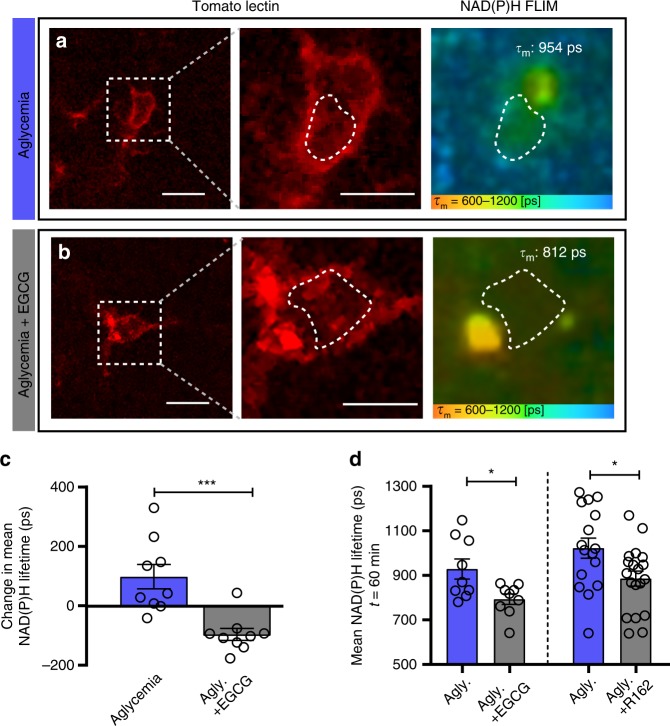
Fig. 6. Glutaminolysis supports the microglial metabolic adaptation to aglycemia in situ.
a, b Representative images of FLIM-NAD(P)H imaging of microglia labeled with tomato lectin, following a 60-min incubation in aglycemic aCSF (a) or aglycemic aCSF with EGCG (b). Indicated on the right panel is the mean NAD(P)H lifetime of the microglial ROI within the dotted line (for a–d: n = 3 mice, 9 microglia for aglycemia, n = 3 mice, 9 microglia for aglycemia+EGCG). c Relative change in mean NAD(P)H lifetime of microglia over 60 min of treatment (***p = 0.0006, unpaired, two-tailed t-test). d Left bars, mean NAD(P)H lifetime of microglia after a 60-min incubation in aglycemia aCSF, with or without EGCG (100 µM; *p = 0.0174, unpaired, two-tailed t-test). Right bars, mean NAD(P)H lifetime of microglia after a 60-min incubation in aglycemia aCSF, with or without R162 (200 µM; *p = 0.0200, unpaired, two-tailed t-test; n = 3 mice, 16 microglia for aglycemia, n = 3 mice, 19 microglia for aglycemia+R162). Data are represented as mean ± SEM. Source data are provided as a Source Data file. See also Supplementary Fig. 5.

