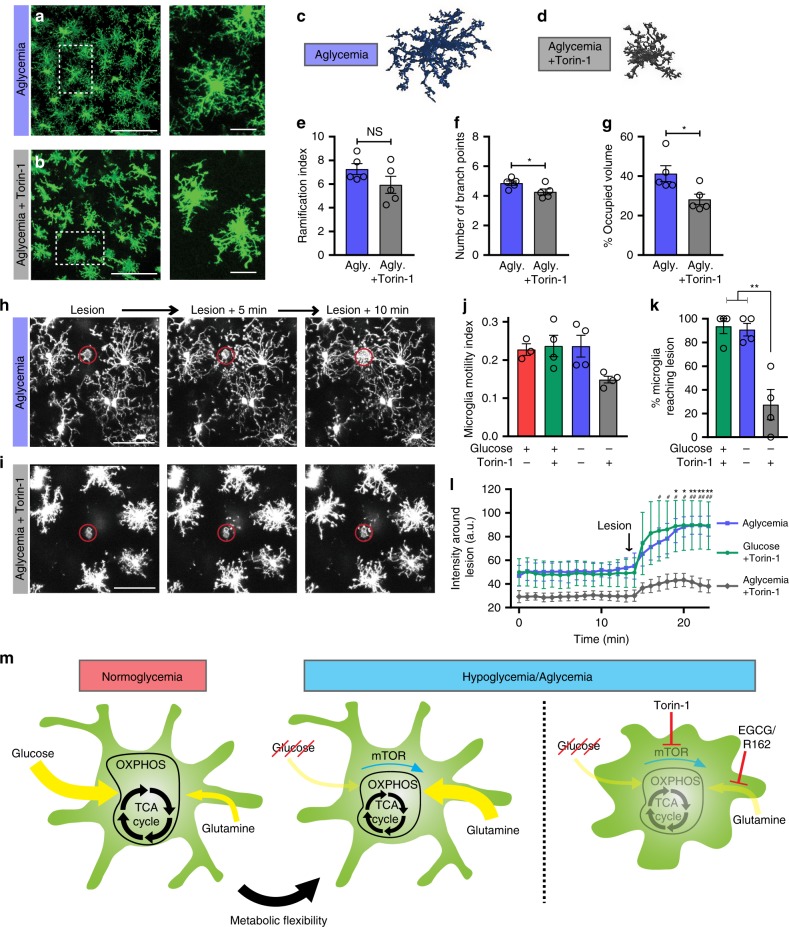
Fig. 9. Microglial metabolic flexibility is mTOR-dependent.
a, b In acute brain slices, microglial morphology following a 60-min incubation in aglycemic aCSF (a) or aglycemic aCSF with Torin-1 (b) (for panel a–g, aglycemia: n = 5 mice, 9 slices, 228 cells; aglycemia+Torin-1: n = 5 mice, 11 slices, 232 cells). c, d 3DMorph rendering of representative microglial cells following a 60-min incubation in aglycemic aCSF c or aglycemic aCSF with Torin-1 d. e Ramification index of microglia 60 min after aglycemia or aglycemia+Torin-1 incubation (NS, p > 0.05, unpaired, two-tailed t-test). f Number of branch points per microglia (*p = 0.0442, unpaired, two-tailed t-test). g Percentage of brain volume occupied by microglia (*p = 0.0264, unpaired, two-tailed t-test). h, i Microglial response to a laser-induced lesion following a 60-min incubation in aglycemic aCSF (h) or aglycemic aCSF with Torin-1 (i) (for h–l, n = 3 slices for control, 4 slices for treatment conditions). j Microglial motility index after 60-min incubations in the indicated conditions. Shown here is the mean microglial motility for a 15-min imaging period following the incubation time. k Percentage of microglia surrounding the lesion (within a 75 µm radius of the lesion) with processes reaching the lesion within 20 min (**p = 0.0012 and 0.0017; one-way ANOVA). l Quantification over time of the change in fluorescence intensity of the area around the lesion (not including the lesion) (*p < 0.05; **p < 0.01 for glucose+Torin-1 vs aglycemia+Torin-1; #p < 0.05; ##p < 0.01 for aglycemia vs aglycemia+Torin-1, two-way ANOVA). m Graphical summary of the proposed microglial metabolic flexibility. Data are represented as mean ± SEM. Source data are provided as a Source Data file. See also supplementary Fig. 8.

