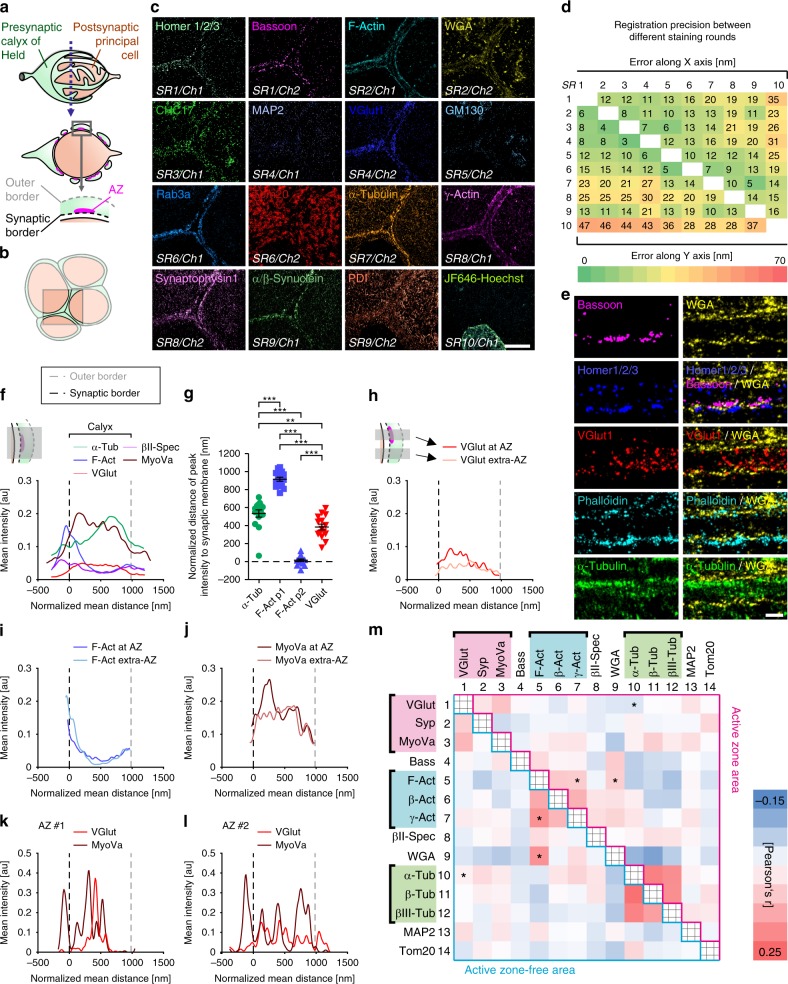
Fig. 3. Multiplex dSTORM of the calyx of Held synapse.
a Schematic representation of the calyx of Held synapse with the cross-section revealing multiple swellings with active zones (AZ) and zoom-in delineating borders relevant for analysis. b Cartoon illustrating the topology of adjacent calyces as represented in c. c STORM images showing 16 targets of the same section acquired in 10 consecutive staining rounds (SR) using one or two spectral channels (Ch). d High registration precision (3–47 nm) of images shown in b achieved throughout all SRs. e Magnified images of cross-section of calyces (as depicted in a). Homer, bassoon, and WGA stainings confirm imaging plane-perpendicular orientation. f Presynaptic distribution of selected proteins analyzed and averaged over 9–15 calyces from 3 to 5 experiments. Calyx borders derived from WGA staining. g Distances of α-Tub peak, first and second F-Act peak (p1, p2), and VGlut1 peak to synaptic membrane differed significantly (**p ≤ 0.01; ***p ≤ 0.001, one-way ANOVA). h–j Differential protein distribution within regions containing or lacking AZs (see inset in h). h Synapse-proximal regions contain more synaptic vesicles (SVs) (VGlut1 staining) at AZ sites as compared with extra-AZ regions. i Less polymerized actin in AZ-proximal regions. j More MyoVa at AZ sites, correlating with VGlut1 profile. k, l Example of single AZs supports correlation between SV and MyoVa distribution and illustrates individuality of AZs. m Colocalization matrix showing Pearson’s r coefficients (exact values, see Supplementary Fig. 14) between all combinations of 14 analyzed proteins at AZ-proximal (upper matrix part) and AZ-free (lower part) calyx regions. Asterisks denote statistical significance for colocalization of selected protein pairs (*p ≤ 0.05; unpaired two-tailed Student’s t test). Scale bars correspond to 5 µm in c and 500 nm in e. Scatter plot g shows mean ± SD. Note that in addition to representative images in c and e another six and three experiments were carried out, respectively, with similar designs and outcomes. For exact sample numbers, see Supplementary Table 5. Source data, including exact p values for g and m, are provided as a Source Data file.

