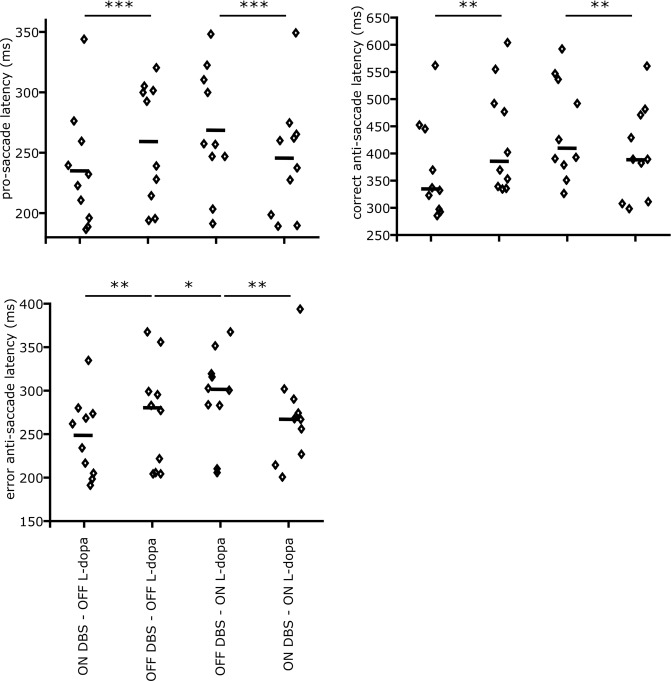
Figure 3.
Anti-saccade and pro-saccade latencies for different stimulation and L-dopa states. The small diamonds show the measured values for individual patients, and small horizontal lines show the median values. (a) The effect of DBS and L-dopa on the pro-saccade latency. Based on our analysis of variance (two-way ANOVA), DBS decreases the pro-saccade latency in both L-dopa conditions (). L-dopa increases pro-saccade latency, but it is marginally significance (). (b) The effect of DBS and L-dopa on the correct anti-saccade latency. DBS decreases the correct anti-saccade latency in both L-dopa conditions (). The effect of L-dopa on the correct anti-saccade latency is not statistically significant, but follows the same pattern as in the pro-saccade latency. (c) The effect of DBS and L-dopa on the erroneous pro-saccade latency in the anti-saccade task. All statistics are driven from a fitted mixed-effect generalized linear model (GLME), where the L-dopa and DBS conditions were used as the fixed-effects and the patients’ identity as the random-effect.

