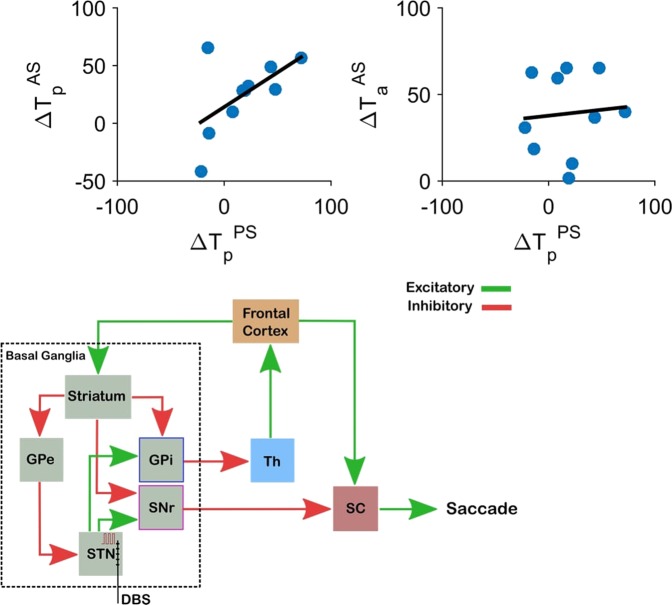
Figure 5.
The effect of DBS on pro- vs. anti-saccade latencies. Blue circles show the change in latencies for pro- and anti-saccade in each individual participant. The dark line is the fitter linear model to the data. (Top-left) There is a strong positive correlation between the change in the pro-saccade latencies in the both pro-saccade and the anti-saccade tasks (, ). (Top-right) The changes in the pro-saccade latency and the anti-saccade latency caused by DBS are not correlated (, ). (Bottom) A schematic of the oculomotor network that involves the basal ganglia and relevant projections. Excitatory (green) and inhibitory (red) projections are shown. SNr and GPi, the two output nuclei of the basal ganglia, project to SC and thalamus (Th). STN DBS can influence saccades through either the GPi-Th-Frontal Cortex pathway, or the SNr-SC pathway. Lower brainstem, cerebellar and extra-frontal cortical oculomotor pathways are not illustrated.

