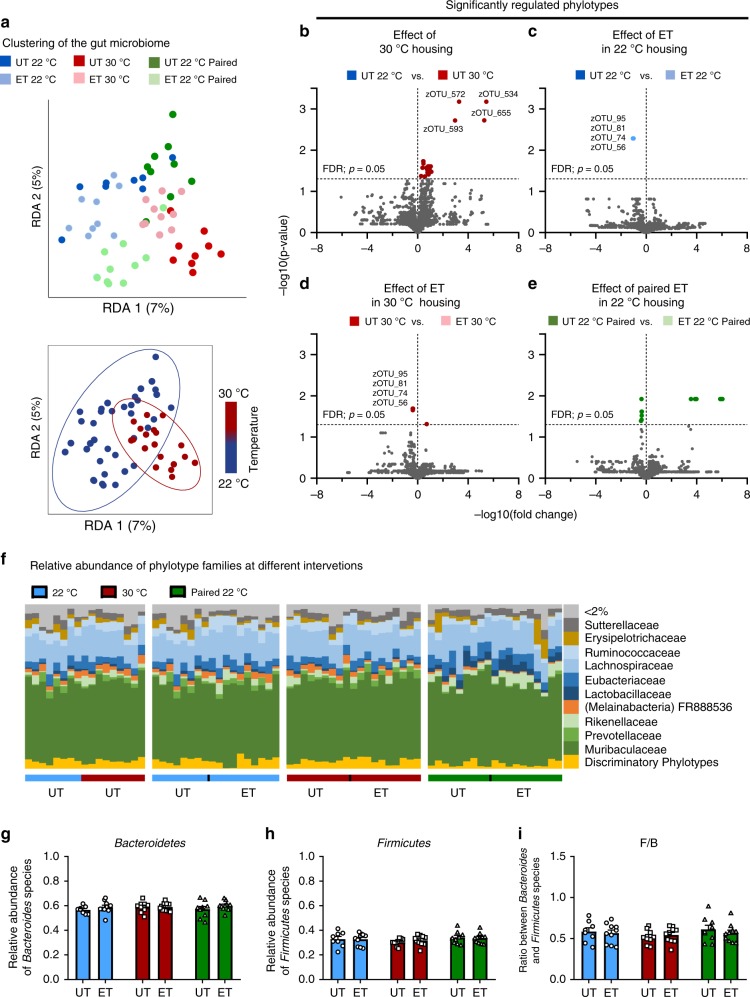
Fig. 6. Thermoneutral housing supersedes the effect of exercise on gut microbiome composition.
a Housing mice at 30 °C markedly alters gut microbiome composition with minor effect of exercise training (ET). Upper panel: dbRDA on Bray-Curtis distance of cecal 16S rRNA gene (V3-region) amplicons (zOTU level) and adjusted for the time effect of the paired-treatments (See Supplementary Fig. 5c for unconstrained Bray-Curtis PCoA plot). Lower panel: dbRDA plot of cecal (similar as above) clustering GM samples by housing temperature. The groups are separated by the colors indicated in the figure. ANOSIM test determined significant differences between experimental groups with mice housed at 22 °C, 30 °C, and paired 22 °C [R > 0.13, p < 0.04], were observed. 22 °C untrained (UT); n = 8, 22 °C ET; n = 10, 30 °C UT; n = 9, 30 °C ET; n = 10, paired 22 °C UT; n = 10, paired 22 °C ET; n = 10. b–e Volcano plots showing the change of specific phylotypes (zOTUs) within the different experimental groups; untrained mice at 22 °C and 30 °C (b), ET at 22 °C (c), ET at 30 °C, and ET at paired 22 °C; t-test, FDR p ≤ 0.05 indicated. 22 °C UT; n = 8, 22 °C ET; n = 10, 30 °C UT; n = 9, 30 °C ET; n = 10, paired 22 °C UT; n = 10, paired 22 °C ET; n = 10. f The relative abundance of species summarized to the family level as indicated. 22 °C UT; n = 8, 22 °C ET; n = 10, 30 °C UT; n = 9, 30 °C ET; n = 10, paired 22 °C UT; n = 10, paired 22 °C ET; n = 10. g–i The relative abundance of bacteroidetes (g) and Firmicutes (h), and the ratio (i) between these two phyla. Statistical testing; Two-way ANOVA. 22 °C UT; n = 8, 22 °C ET; n = 10, 30 °C UT; n = 9, 30 °C ET; n = 10, paired 22 °C UT; n = 10, paired 22 °C ET; n = 10. The “n = x” defines the number of biologically independent animals used for the analyses.

