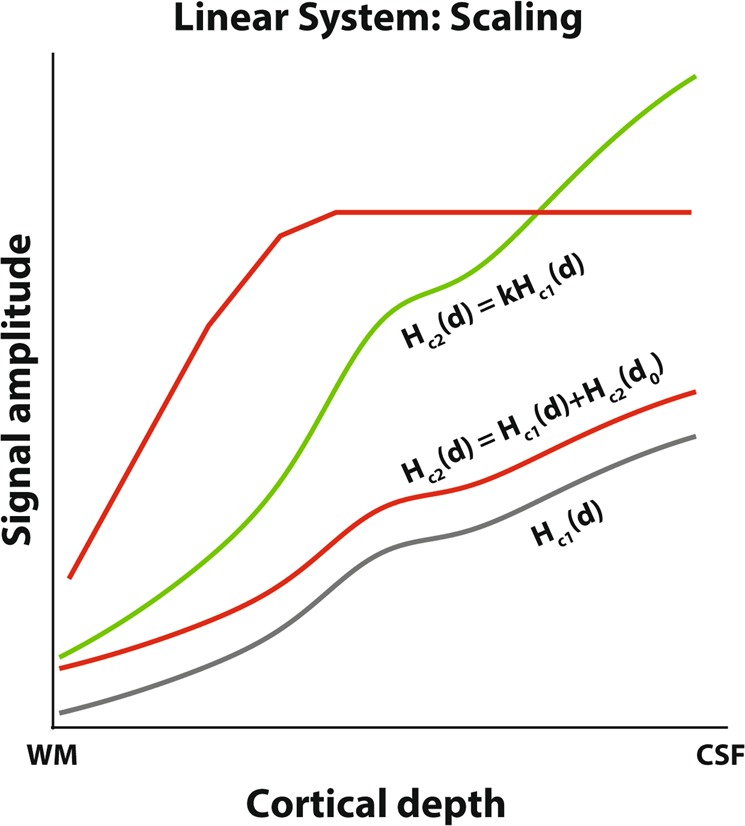
Figure 1.

Theoretical response amplitude changes across cortical depth as luminance contrast increases. See also Eq. 4. WM = white matter, CSF = cerebrospinal fluid. Gray line: Base response amplitude across cortical depth for a given contrast, Hc(d), red and green lines indicate theoretical response changes as the luminance contrast increases. The green line satisfies the scaling requirement according to linear system theory, i.e. the response increase corresponds to a multiplication of Hc(d) with a scaling factor k, resulting in kHc(d). Both red lines indicate potential increases in responses that do not follow linear system theory. The lower red line corresponds to adding a response at the deepest cortical depth d0, and the resulting draining offset to the original BOLD response, Hc(d) + Hc2(d0). Although this is a linear transformation, this does not satisfy the scaling requirement for a linear system. The upper red line corresponds to a response increase that includes a maximum response. A maximum response is also a nonlinear - and biologically plausible - transformation.
