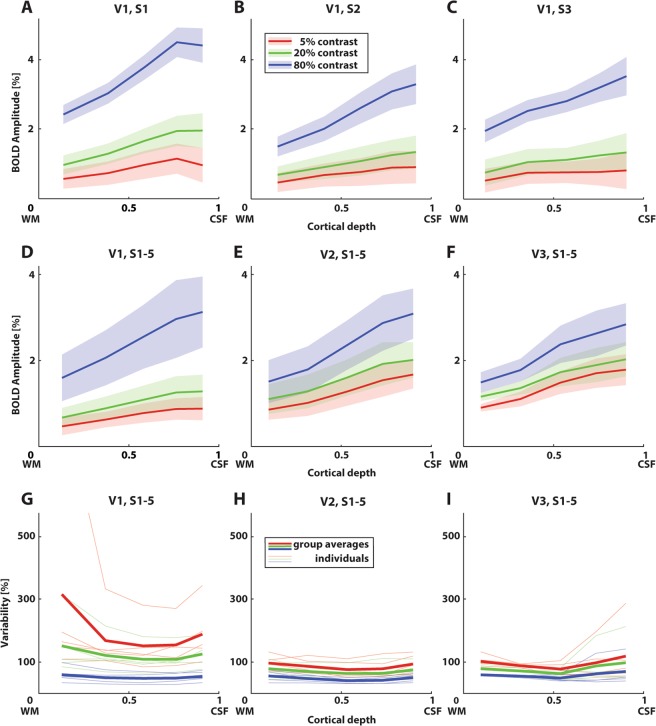
Figure 2.
BOLD response amplitudes as a function of cortical depth and different luminance contrasts for the first session. (A–C) BOLD response amplitudes across cortical depth for three example participants, for visual field map V1. Error regions represent 95% confidence intervals (+/−1.96 standard errors of the mean) across repeated stimulus presentations for a region of interest, for each depth bin and luminance contrast. Panels for the other participants can be found in Fig. S2. (D–F) Group averages for visual field map V1, V2, and V3. BOLD response amplitudes increase with luminance contrast and towards the cortical surface. Error regions represent 95% confidence intervals of the mean response across depth between subjects. (G–I) Variability (standard deviation across repeated stimulus presentations divided by the mean across voxels, in percentage) over depth for visual field map V1, V2, and V3. Thin lines denote individual subject. Thick lines denote group averages. Line colors correspond to luminance contrast, as in (A–F).

