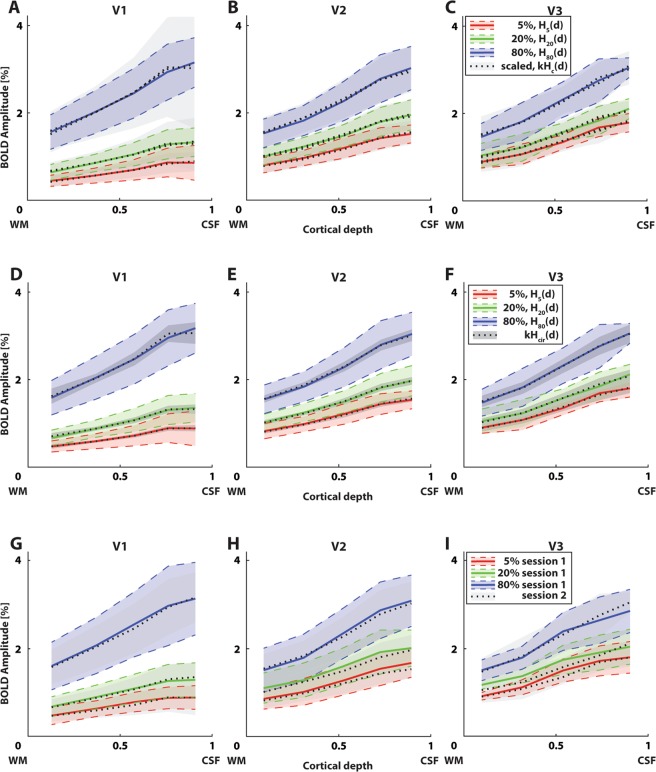
Figure 4.
BOLD response amplitude and amplitude scaling for the second session are very similar to the first session. (A–C) Measured BOLD response across cortical depth of the second session for different contrasts (colored lines) and visual field maps (different panels), overlaid with scaled responses to other contrasts (dashed lines). These scaled responses explained 96–99% of variance. Error regions represent 95% confidence intervals of the mean response across depth between subjects. These are scaled by a factor k for the scaled responses (see Table 1). (D–F) Measured BOLD response across cortical depth of the second session for different contrasts (colored lines) and visual field maps (different panels), overlaid with responses scaled from the contrast-independent laminar response curve (Hcir(d)). These scaled responses explained 99% of variance. Error regions represent 95% confidence intervals of the mean contrast-independent laminar response curve. These are scaled by a factor k for the scaled responses (see Table 2). (G–I) Group average BOLD response amplitudes across cortical depth for the first session (solid lines) and second session (dotted lines, grayscale). Error regions represent 95% confidence intervals of the mean response across depth between subjects. Responses for both sessions matched almost perfectly (explained variance 99%).

