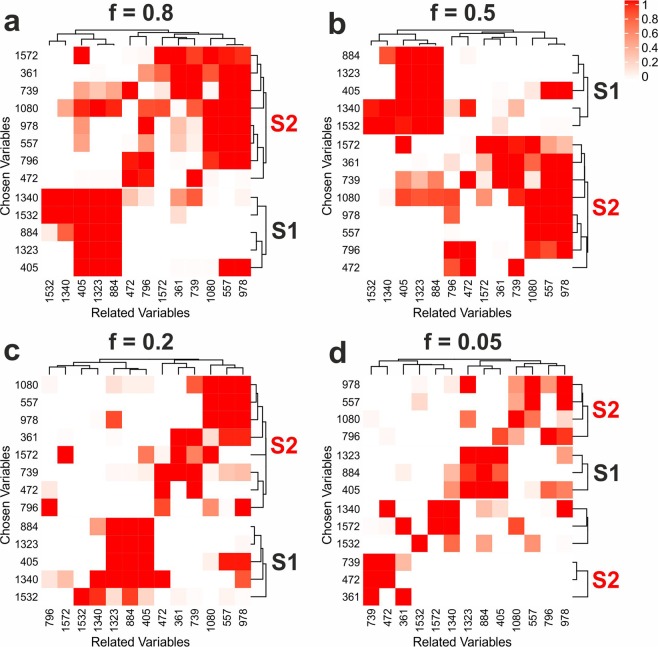
Figure 4.
Results of variable relations analysis for the SERS data sets with f = 0.8 (a), 0.5 (b), 0.2 (c), and 0.05 (d). Heatmaps of the selection frequencies using all band maxima of the characteristic spectra as chosen and also as potentially related variables over all 50 replicates are shown. K-means clustering with Euclidean distance was applied and groups that are characteristic for a single spectrum are labeled with S1 (single spectrum 1) and S2 (single spectrum 2). This figure was generated using the software R33 (version 3.5.2) and CorelDRAW (version 19.1.0.419).

