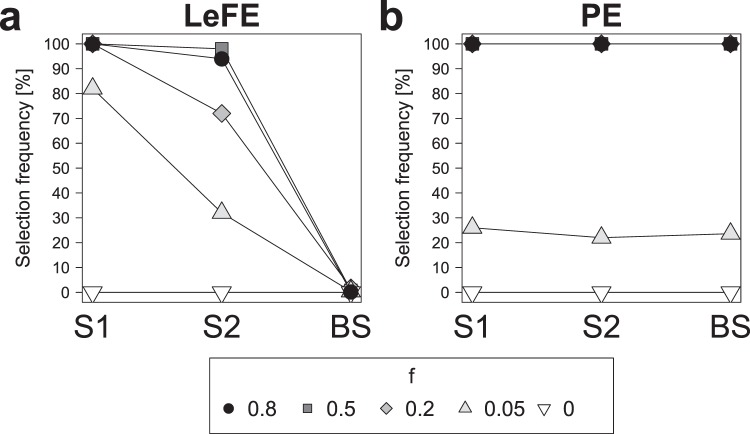
Figure 5.
Performance comparison of the approaches Learner of Functional Enrichment (LeFE, a) and prediction error (PE, b). Selection frequencies over all 50 replicates for the SERS data sets with f = 0.8, 0.5, 0.2, 0.05, and 0 are shown. In the analysis the bands of the twelve single spectra were used as predefined groups and the performances of spectrum 1 (S1) and 2 (S2) are individually displayed while the performance of the background spectra 3 to 12 (BS) is averaged. This figure was generated using the software R33 (version 3.5.2).

