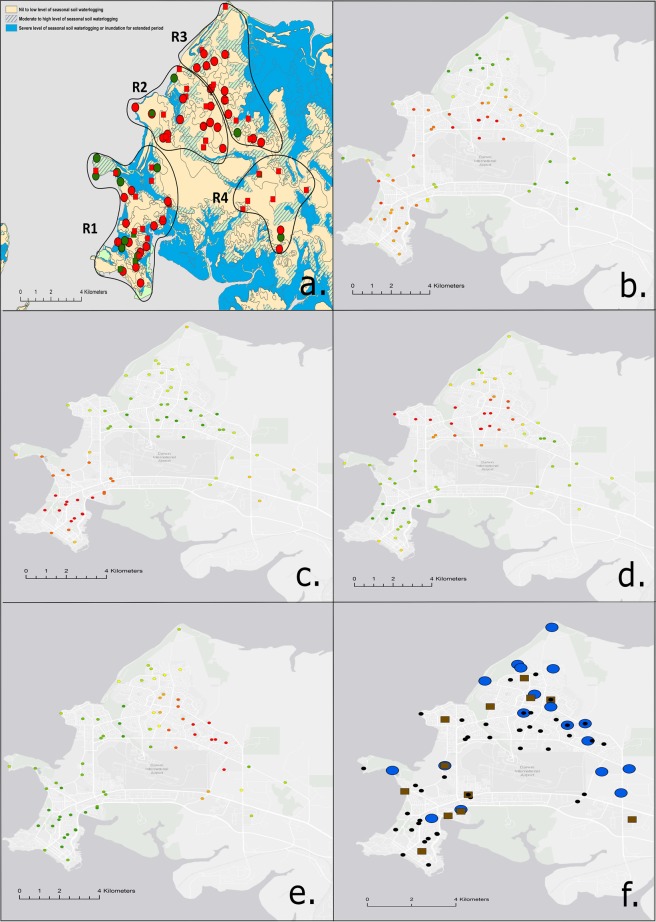
Figure 1.
The four urban Darwin regions specified by catchment areas and direction of surface runoff at each survey site (a). Levels of seasonal surface runoff and areas of waterlogging are indicated by colour (yellow; nil to low levels of seasonal waterlogging, green stripes; moderate to high levels, blue; severe levels of waterlogging to fully inundated over extended period). B. pseudomallei positive and negative park sites (n = 45, red and green circles, respectively) and positive and negative drain sites (n = 42, red and green squares, respectively) surveyed during the 2017 rainy season (Feb-March). Getis-Ord Gi* Hot Spot Analysis (b–e). Areas with significant “hot” spots are indicated by dark red circles while “cold” spots are shown in green ((b) ST-36, (c) ST-109, (d) ST-327, (e) ST-553). Significant association of Bayes Cluster 1 with drain sites (blue circles – water and soil) as opposed to parks (brown squares - soil) (f). Bayes cluster 1 negative sites are denoted by black circles (ArcGIS v.10.4.1 (ESRI)).

