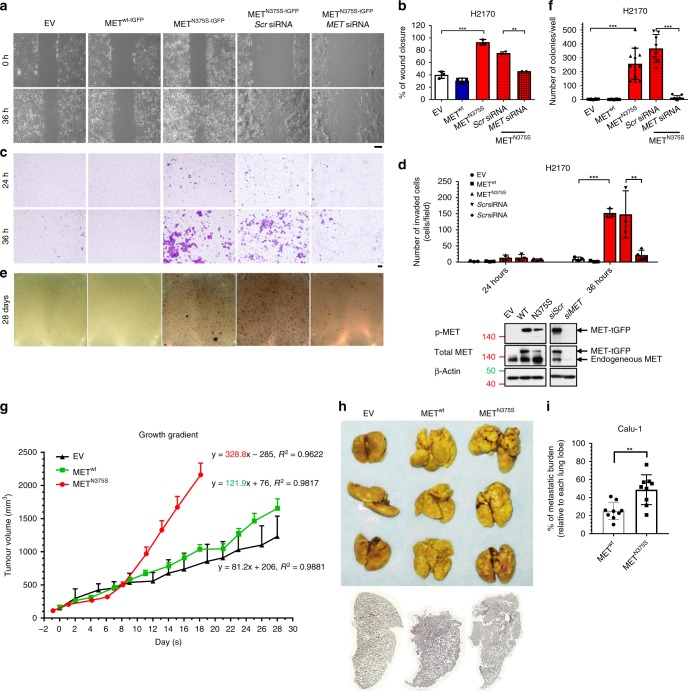
Fig. 2. METN375S induces gain-of-function (GOF) phenotype in SCC cells.
a–f Cell migration, invasion, and colony-forming assays were performed on isogenic H2170 empty vector (EV), wild-type (METwt-tGFP), and N375S mutant (METN375S-tGFP) clones with and without siRNA silencing. In total, 10 nM of scrambled (Scr) or MET siRNA was used per transfection. Immunoblots demonstrating expression levels of the total and phosphorylated MET are shown (bottom right). β-Actin was used as a loading control. a, b Wounded areas (eight fields/sample) were imaged at 0 h and 36 h after monolayer cultures were scratched. a Representative images are shown. Scale bar: 200 μm. The wound-closure percentages for (b) EV, METwt-tGFP and METN375S-tGFP cells; Scr and MET siRNA transfected cells were quantified and expressed as mean ± SD (n = 3). Two-tailed Student’s t test; *P < 0.05. c, d For invasion assay, cells seeded in Matrigel invasion chambers were fixed and stained at 24 or 36 h, respectively. c Representative images are shown. Scale bar: 200 μm. The number of cells in four random microscopic fields were quantified for EV, METwt-tGFP, and METN375S-tGFP cells; Scr and MET siRNA transfected cells (d), and expressed as mean ± SD in each field (n = 3). Two-tailed Student’s t test; *P < 0.05. e, f Representative images of colony formation for each cell types, stained with MTT at assay endpoint (e). The number of colonies were quantified for EV, METwt-tGFP and METN375S-tGFP H2170 cells; Scr and MET siRNA transfected cells (f) and expressed as mean of triplicates ± SD (n = 3). Two-tailed Student’s t test; *P < 0.05. g Tumor growth of EV, METwt-tGFP, and METN375S-tGFP cells in xenografts with growth gradient displayed on the chart, presented as mean growth ± SEM (n = 5). h–i Pulmonary metastases models were established with isogenic Calu-1 EV, METwt-tGFP, and METN375S-tGFP cells. h Macroscopic images of Bouin’s-stained lungs from three individual female mice per group, dosed by tail vein injection of the respective cells. White spots on the lungs are visible metastatic colonies. Below, representative stitched scanned images of H&E-stained paraffin-embedded lung cross section. i Metastatic tumor burden was quantified based on percentage of tumor area in respective lung tissues, three lung lobes per mice, presented as mean ± SD (n = 3).

