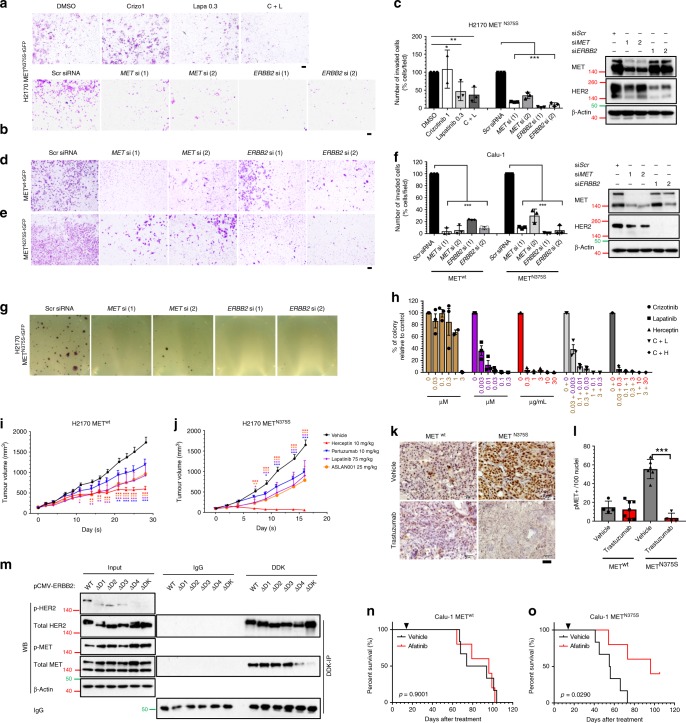
Fig. 6. Therapeutic targeting of METN375S tumors using inhibitors of HER2 signaling.
a–c Cellular invasion on isogenic wild-type (METwt-tGFP) and N375S mutant (METN375S-tGFP) clones, treated with kinase inhibitors or siRNA silencing of MET or HER2, were being evaluated. a H2170 METN375S-tGFP cells were treated with crizotinib (10 µM), lapatinib (0.3 µM) or a crizotinib/lapatinib combination for 36 h. Representative images of cell invasion are shown. b H2170 METN375S-tGFP cells were co-incubated with 10 nM of the indicated siRNA overnight, and seeded in Matrigel invasion chambers for 36 h. Representative images are shown. Scale bar: 200 μm. c Percentage of invaded cells relative to vehicle control (0.1% DMSO) or Scr siRNA control were expressed as mean ± SD (n = 3). One-way ANOVA; *P < 0.05, **P < 0.01, ***P < 0.001. Left, immunoblots of siRNA-treated H2170 METN375S-tGFP cells. For immunoblots, cells were harvested 48 h after siRNA treatment, and β-actin was used as a loading control. d–f Calu-1 METwt-tGFP and METN375S-tGFP cells were co-incubated with 10 nM of the indicated siRNA overnight, and seeded in Matrigel invasion chambers for 24 h. Representative images of cell invasion for METwt-tGFP (d) and METN375S-tGFP cells (e) are shown. Scale bar: 200 μm. f Percentage of invaded cells relative to Scr siRNA control in Calu-1 METwt-tGFP and METN375S-tGFP cells were expressed as mean ± SD (n = 3). Left, immunoblots of siRNA-treated Calu-1 METN375S-tGFP cells. For immunoblots, cells were harvested 48 h after siRNA treatment, and β-actin was used as a loading control. One-way ANOVA; *P < 0.05, **P < 0.01, ***P < 0.001. g, h Anchorage-independent colony formation on isogenic H2170 METN375S-tGFP cells, treated with kinase inhibitors or siRNA silencing of MET or HER2, were being evaluated. g H2170 METN375S-tGFP cells were co-incubated with 10 nM of the indicated siRNA overnight, and seeded in soft agar for 4 weeks. Representative images are shown. h The number of colonies were quantified after treatment with crizotinib, lapatinib, trastuzumab, or in combination. Data were presented as percentage of colonies relative to vehicle control (0.1% DMSO) ± SD (n = 3). i–l Efficacies of HER2 inhibitors were evaluated in xenograft models. Tumor growth of METwt-tGFP (i) and METN375S-tGFP (j) xenografts after treatment with trastuzumab, pertuzumab, lapatinib, and ASLAN001 were expressed at mean ± SEM (n = 5). Two-way ANOVA; *P < 0.05, **P < 0.01, ***P < 0.001. k Immunohistochemistry staining showing the changes in p-MET after treatment with trastuzumab in METwt-tGFP and METN375S-tGFP tumors. Representative images are shown. Scale bar, 50 µm. l Expression of p-MET was quantified and expressed at mean of positive-staining/100 cells ± SD (n = 5). Two-tailed Student’s t test; *P < 0.05, **P < 0.01, ***P < 0.001. m HEK293 cells were transfected with 1 µg of either pCMV6-ERBB2-wt, ∆D1, ∆D2, ∆D3, ∆D4, or ∆TK plasmid, together with pCMV6-MET-N375S plasmid, for 24 h. MET/HER2 interaction in HEK293 cells was detected with immunoprecipitation and immunoblotting. Left, input controls and phosphorylated proteins. β-Actin was used as a loading control. n, o Isogenic Calu-1 METwt-tGFP (n) and METN375S-tGFP (o) cells were engrafted into SCID mice, and treated daily with vehicle (n = 6) or 15 mg/kg afatinib (n = 5) starting 14 days after inoculation. Arrows indicate treatment start date. Kaplan–Meier analyses of the mice are shown.

