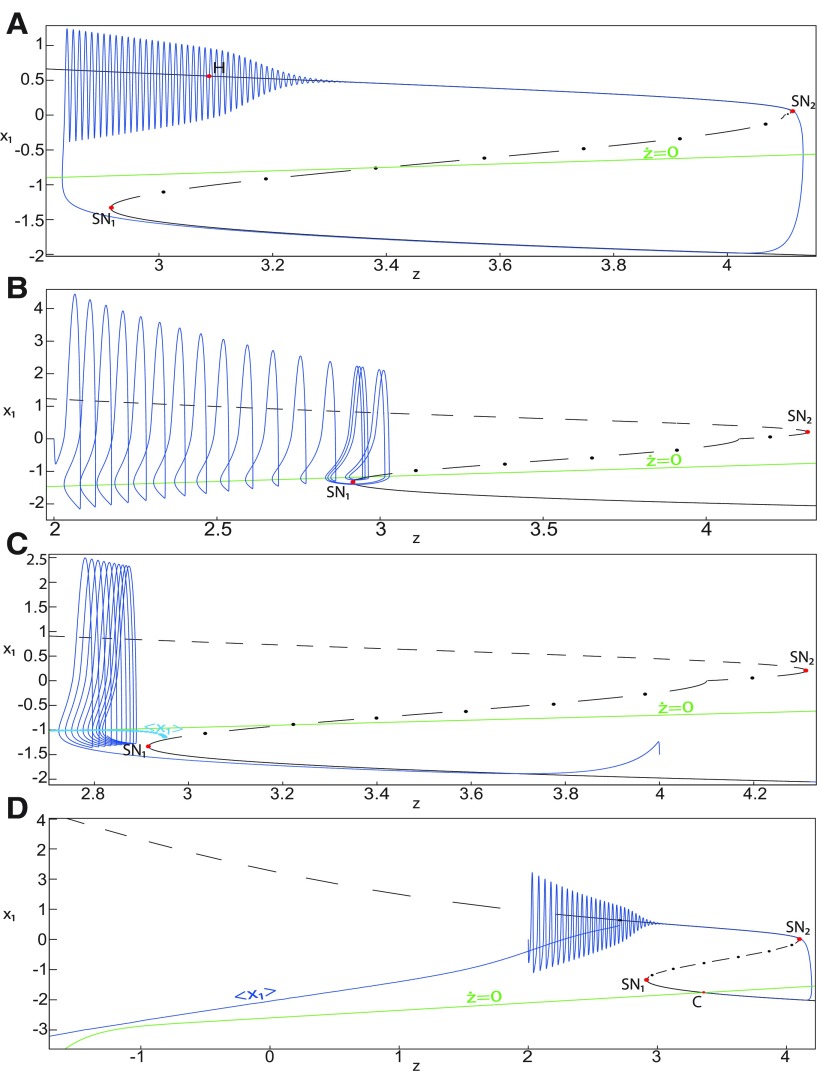
Figure 46.
The () subsystem 1 bifurcation diagram with respect to z as m and x0 vary. A, m = 0.5 and x0 = −1.6, transitions between upper and lower branches occur through a fold/Hopf bifurcation. B, m = 2 and x0 = −1.9, transitions between upper and lower branches occur through a fold/homoclinic bifurcation. C, m = 2 and x0 = −1.7, the fast-slow subsystem stabilizes before a homoclinic bifurcation occurs, giving rise to the stable limit cycle SLC1. D, m = 0 and x0 = −2.6, the fast-slow subsystem stabilizes its stable node, which is the equilibrium point of the NS. The z-nullcline and curve do not intersect, hence NS exists and LC does not. r = 0.0006, I.C = [−0.5 −5 2.831], and Ts = [0:0.01: 1120] for A; r = 0.002, I.C = [0 −5 2], and Ts = [0:0.01: 1300] for B; r = 0.003, I.C = [−1.5 −5 4], and Ts = [0:0.01: 600] for C; and r = 0.002, I.C = [0 −5 2], and Ts = [0:0.01: 1000] for D.

