Figure 9.
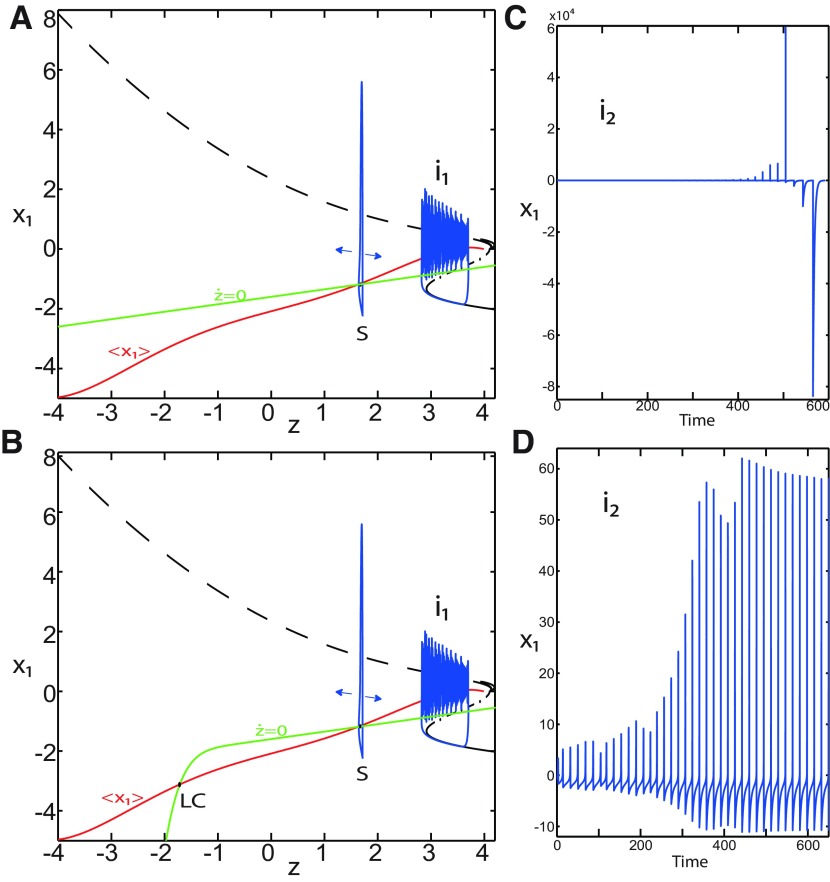
On the LC existence and dynamics. The Epileptor model bifurcation diagram (z, x1) with respect to z (m = 0.5, Iext2 = 0.45, x0 = −1.6). A, B, The z-nullcline is given by Equation 34 (A), and results from Equation 35 (B). The -curve is the average value of x1 for each z constant. C, D, Characteristic time series (deterministic) show a divergence of the Epileptor with time (C), and the fast-slow limit cycle LC (D). r = 0.009 for LC (i2) and r = 0.0007 for SLEs (i1).

