Figure 4.
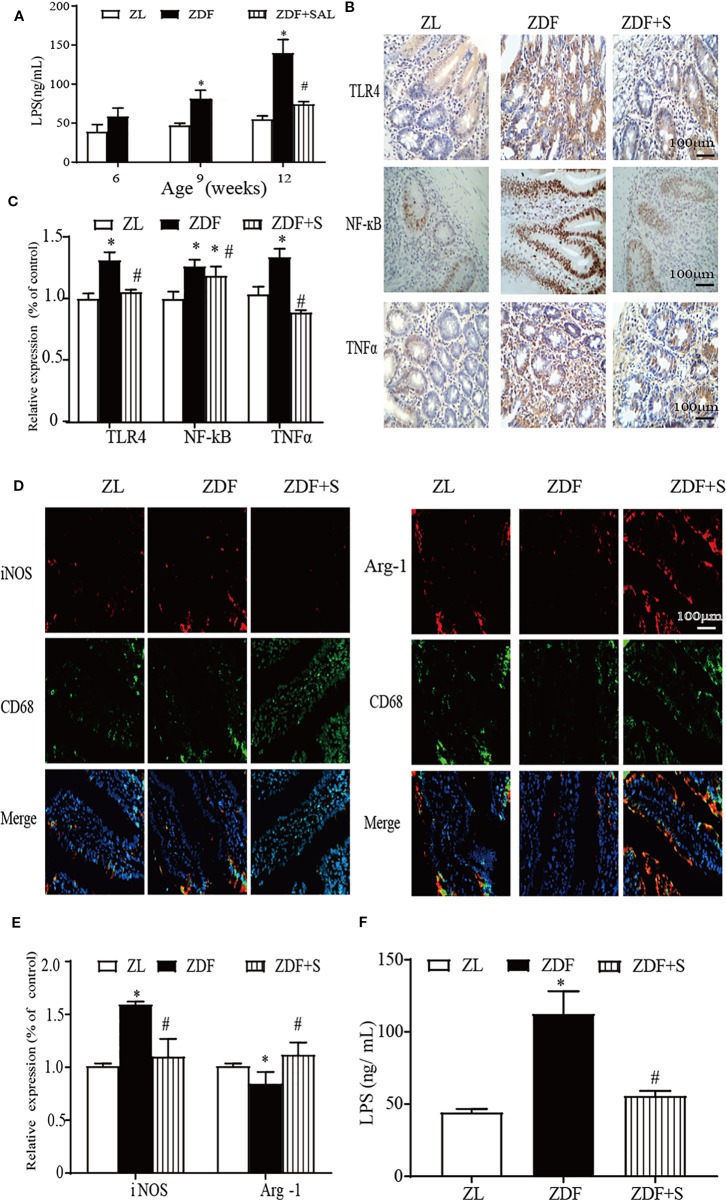
SAL treatment attenuated intestinal mucosal inflammation in ZDF rats. (A) LPS level in ileum extract supernatant. (B, C) Immunohistochemical (IHC) quantification and analysis of TLR4, NF-кB, and TNF-α expression (original magnification: ×400; scale bar: 100 μm). (D, E) Immunofluorescence quantification and analysis of iNOS (represents M1 macrophage), Arg-1 (represents M2 macrophage) (original magnification: ×400; scale bar: 100 μm). (F) Serum LPS level. One-way ANOVA followed by Tukey's test compared differences between group pairs. Data are means ± SEM. *P < 0.05 vs. ZL rats; #P < 0.05 vs. ZDF rats.

